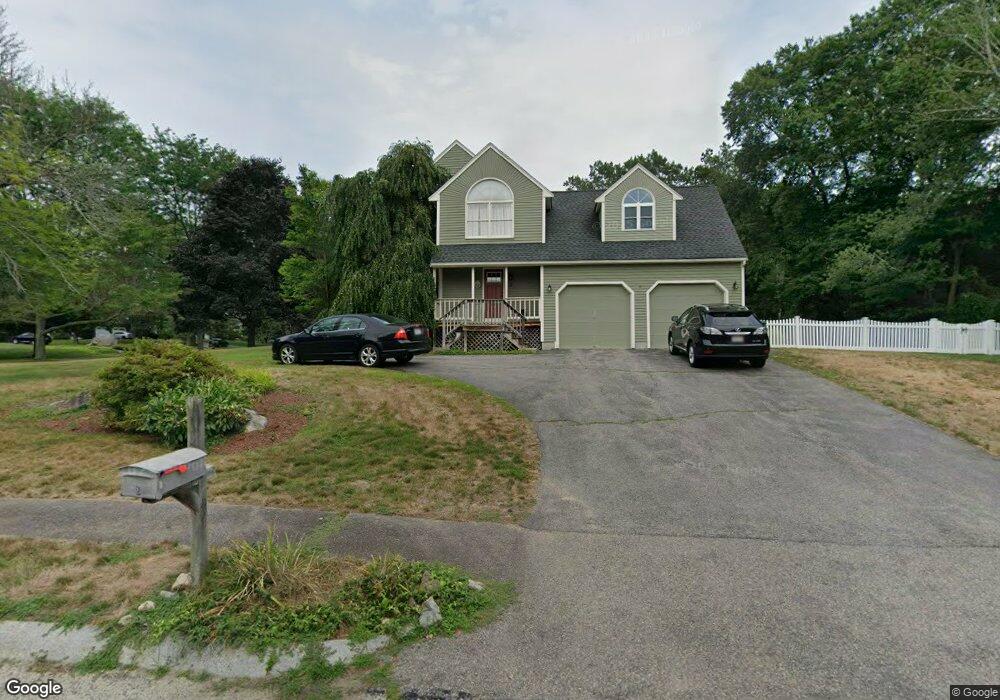
2 Gordon Ct Mansfield, MA 02048
Estimated Value: $936,113 - $1,062,000
4
Beds
3
Baths
2,839
Sq Ft
$353/Sq Ft
Est. Value
About This Home
This home is located at 2 Gordon Ct, Mansfield, MA 02048 and is currently estimated at $1,000,778, approximately $352 per square foot. 2 Gordon Ct is a home located in Bristol County with nearby schools including Everett W. Robinson Elementary School, Jordan/Jackson Elementary School, and Harold L. Qualters Middle School.
Ownership History
Date
Name
Owned For
Owner Type
Purchase Details
Closed on
May 30, 2002
Sold by
Small Steven F and Small Taryne K
Bought by
Hyland Robert A and Hyland Patricia A
Current Estimated Value
Purchase Details
Closed on
Apr 4, 1991
Sold by
Brookdale Corp
Bought by
Small Steven F and Small Taryse K
Create a Home Valuation Report for This Property
The Home Valuation Report is an in-depth analysis detailing your home's value as well as a comparison with similar homes in the area
Home Values in the Area
Average Home Value in this Area
Purchase History
| Date | Buyer | Sale Price | Title Company |
|---|---|---|---|
| Hyland Robert A | $485,000 | -- | |
| Small Steven F | $272,000 | -- |
Source: Public Records
Mortgage History
| Date | Status | Borrower | Loan Amount |
|---|---|---|---|
| Closed | Small Steven F | $164,000 | |
| Closed | Small Steven F | $188,000 | |
| Closed | Small Steven F | $200,000 |
Source: Public Records
Tax History Compared to Growth
Tax History
| Year | Tax Paid | Tax Assessment Tax Assessment Total Assessment is a certain percentage of the fair market value that is determined by local assessors to be the total taxable value of land and additions on the property. | Land | Improvement |
|---|---|---|---|---|
| 2025 | $11,371 | $863,400 | $266,200 | $597,200 |
| 2024 | $10,939 | $810,300 | $278,300 | $532,000 |
| 2023 | $10,157 | $720,900 | $278,300 | $442,600 |
| 2022 | $9,732 | $641,500 | $257,600 | $383,900 |
| 2021 | $3,074 | $654,300 | $242,800 | $411,500 |
| 2020 | $5,448 | $643,400 | $242,800 | $400,600 |
| 2019 | $9,586 | $629,800 | $225,600 | $404,200 |
| 2018 | $5,041 | $612,000 | $215,100 | $396,900 |
| 2017 | $8,938 | $595,100 | $209,000 | $386,100 |
| 2016 | $9,095 | $590,200 | $229,200 | $361,000 |
| 2015 | $8,863 | $571,800 | $229,200 | $342,600 |
Source: Public Records
Map
Nearby Homes