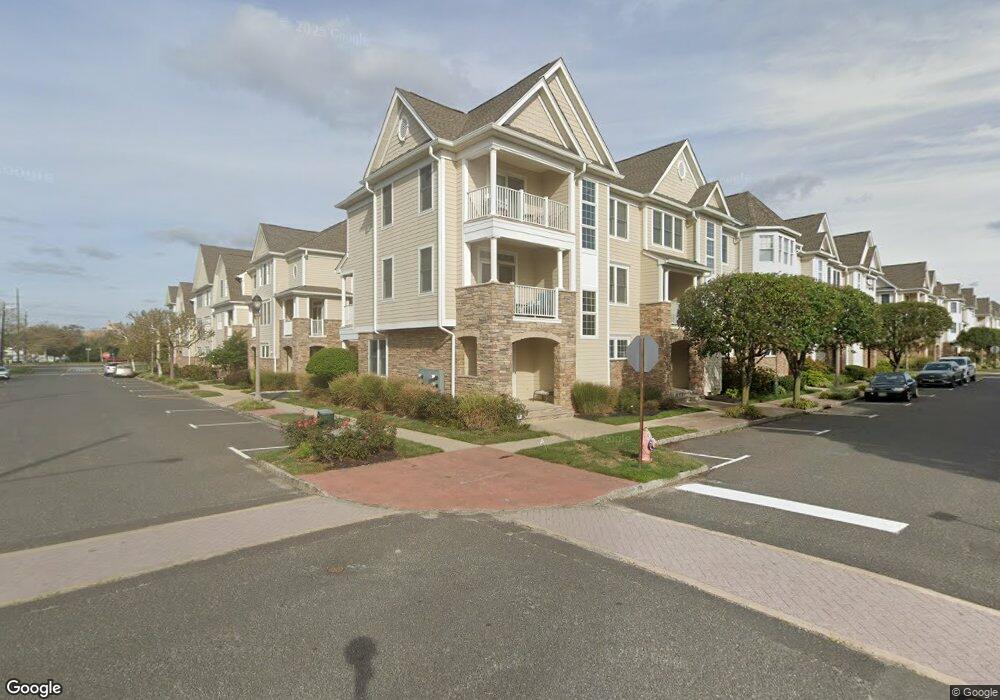
2 Grant St Long Branch, NJ 07740
Estimated Value: $1,812,000 - $2,142,000
3
Beds
3
Baths
3,168
Sq Ft
$609/Sq Ft
Est. Value
About This Home
This home is located at 2 Grant St, Long Branch, NJ 07740 and is currently estimated at $1,930,526, approximately $609 per square foot. 2 Grant St is a home located in Monmouth County with nearby schools including Long Branch High School and Holy Trinity School.
Ownership History
Date
Name
Owned For
Owner Type
Purchase Details
Closed on
May 26, 2005
Sold by
Mm Beachfront North I Llc
Bought by
Shakoor John M and Shakoor Mary Ellen
Current Estimated Value
Home Financials for this Owner
Home Financials are based on the most recent Mortgage that was taken out on this home.
Original Mortgage
$700,000
Outstanding Balance
$365,912
Interest Rate
5.78%
Mortgage Type
New Conventional
Estimated Equity
$1,564,614
Create a Home Valuation Report for This Property
The Home Valuation Report is an in-depth analysis detailing your home's value as well as a comparison with similar homes in the area
Home Values in the Area
Average Home Value in this Area
Purchase History
| Date | Buyer | Sale Price | Title Company |
|---|---|---|---|
| Shakoor John M | $949,900 | -- |
Source: Public Records
Mortgage History
| Date | Status | Borrower | Loan Amount |
|---|---|---|---|
| Open | Shakoor John M | $700,000 |
Source: Public Records
Tax History
| Year | Tax Paid | Tax Assessment Tax Assessment Total Assessment is a certain percentage of the fair market value that is determined by local assessors to be the total taxable value of land and additions on the property. | Land | Improvement |
|---|---|---|---|---|
| 2025 | $21,716 | $1,659,300 | $1,088,100 | $571,200 |
| 2024 | $20,090 | $1,412,900 | $860,400 | $552,500 |
| 2023 | $20,090 | $1,293,600 | $760,400 | $533,200 |
| 2022 | $17,567 | $970,300 | $495,400 | $474,900 |
| 2021 | $17,567 | $877,900 | $424,100 | $453,800 |
| 2020 | $18,601 | $890,000 | $434,100 | $455,900 |
| 2019 | $20,820 | $990,500 | $551,200 | $439,300 |
| 2018 | $20,694 | $978,900 | $551,200 | $427,700 |
| 2017 | $20,097 | $975,100 | $551,200 | $423,900 |
| 2016 | $19,569 | $968,300 | $551,200 | $417,100 |
| 2015 | $16,950 | $761,100 | $388,600 | $372,500 |
| 2014 | $17,204 | $814,200 | $523,600 | $290,600 |
Source: Public Records
Map
Nearby Homes
- 22 Cooper Ave Unit 110
- 69 Ocean Terrace
- 21 Ocean Terrace
- 20 Melrose Terrace Unit 407
- 20 Melrose Terrace Unit 408
- 30 Melrose Terrace Unit 208
- 30 Melrose Terrace Unit 609
- 30 Melrose Terrace Unit 218
- 15 Morris Ave Unit 609
- 15 Morris Ave Unit 525
- 15 Morris Ave Unit 202
- 15 Morris Ave Unit 310
- 15 Morris Ave Unit 505
- 128 Sampson Place
- 136 Sampson Place
- 167 Chelsea Ave
- 200 Ocean Ave N Unit 22
- 200 Ocean Ave N Unit 13
- 236 Seaview Ave
- 145 Sampson Place
Your Personal Tour Guide
Ask me questions while you tour the home.