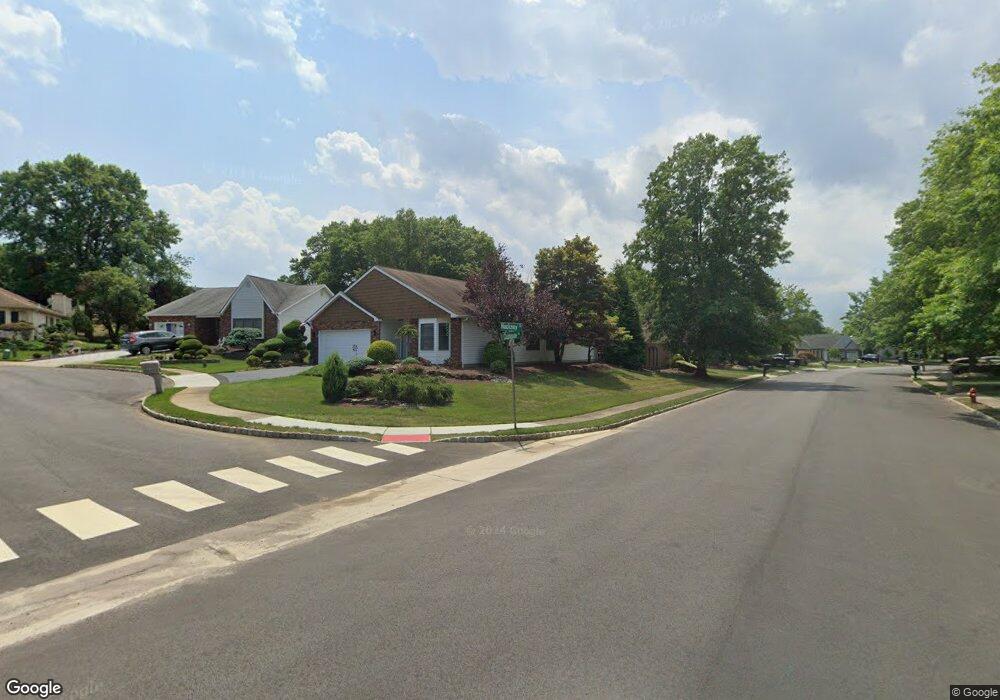
2 Hackney Ct Marlboro, NJ 07746
Estimated Value: $611,441 - $634,000
2
Beds
2
Baths
1,878
Sq Ft
$330/Sq Ft
Est. Value
About This Home
This home is located at 2 Hackney Ct, Marlboro, NJ 07746 and is currently estimated at $619,860, approximately $330 per square foot. 2 Hackney Ct is a home located in Monmouth County with nearby schools including Frank J. Dugan Elementary School, Marlboro Middle School, and Marlboro High School.
Ownership History
Date
Name
Owned For
Owner Type
Purchase Details
Closed on
Jan 14, 2014
Sold by
Broman Robert and Broman Anne
Bought by
Broman Anne
Current Estimated Value
Purchase Details
Closed on
Nov 12, 2010
Sold by
Ferrara Lori and Lilonsky Michael
Bought by
Broman Robert and Broman Anne
Home Financials for this Owner
Home Financials are based on the most recent Mortgage that was taken out on this home.
Original Mortgage
$71,000
Outstanding Balance
$24,509
Interest Rate
4.3%
Mortgage Type
New Conventional
Estimated Equity
$595,351
Purchase Details
Closed on
Jan 12, 2005
Sold by
Kalman Shoshana
Bought by
Lilonsky Frances
Purchase Details
Closed on
Jun 30, 2002
Sold by
Jetter Sandra
Bought by
Kalman Shoshana
Home Financials for this Owner
Home Financials are based on the most recent Mortgage that was taken out on this home.
Original Mortgage
$175,000
Interest Rate
6.36%
Create a Home Valuation Report for This Property
The Home Valuation Report is an in-depth analysis detailing your home's value as well as a comparison with similar homes in the area
Home Values in the Area
Average Home Value in this Area
Purchase History
| Date | Buyer | Sale Price | Title Company |
|---|---|---|---|
| Broman Anne | -- | None Available | |
| Broman Robert | $265,000 | None Available | |
| Lilonsky Frances | $360,000 | -- | |
| Kalman Shoshana | $275,000 | -- |
Source: Public Records
Mortgage History
| Date | Status | Borrower | Loan Amount |
|---|---|---|---|
| Open | Broman Robert | $71,000 | |
| Previous Owner | Kalman Shoshana | $175,000 |
Source: Public Records
Tax History Compared to Growth
Tax History
| Year | Tax Paid | Tax Assessment Tax Assessment Total Assessment is a certain percentage of the fair market value that is determined by local assessors to be the total taxable value of land and additions on the property. | Land | Improvement |
|---|---|---|---|---|
| 2025 | $7,093 | $284,400 | $127,600 | $156,800 |
| 2024 | $6,780 | $284,400 | $127,600 | $156,800 |
| 2023 | $6,780 | $284,400 | $127,600 | $156,800 |
| 2022 | $6,607 | $284,400 | $127,600 | $156,800 |
| 2021 | $6,541 | $284,400 | $127,600 | $156,800 |
| 2020 | $6,538 | $284,400 | $127,600 | $156,800 |
| 2019 | $6,541 | $284,400 | $127,600 | $156,800 |
| 2018 | $6,430 | $284,400 | $127,600 | $156,800 |
| 2017 | $6,305 | $284,400 | $127,600 | $156,800 |
| 2016 | $6,280 | $284,400 | $127,600 | $156,800 |
| 2015 | $5,918 | $272,100 | $119,400 | $152,700 |
| 2014 | $5,409 | $246,100 | $99,400 | $146,700 |
Source: Public Records
Map
Nearby Homes
- 107 Clubhouse Ln
- 102 Murray Hill Terrace
- 72 Murray Hill Terrace
- 62 Murray Hill Terrace
- 39 Homestead Cir
- 29 Coventry Terrace
- 10 Surray Ct
- 26 Lansdale Dr
- 41 Lakeview Dr
- 62 Steeplechase Dr
- 69 School Rd W
- 69 Caldwell Terrace
- 126 Wyncrest Rd
- 16 Jacata Rd
- 27 Hummingbird Ct
- 118 Pelican Ct
- 4 Terrace Dr
- 254 Plum Dr
- 23 Woodpecker Way
- 41 Longstreet Rd