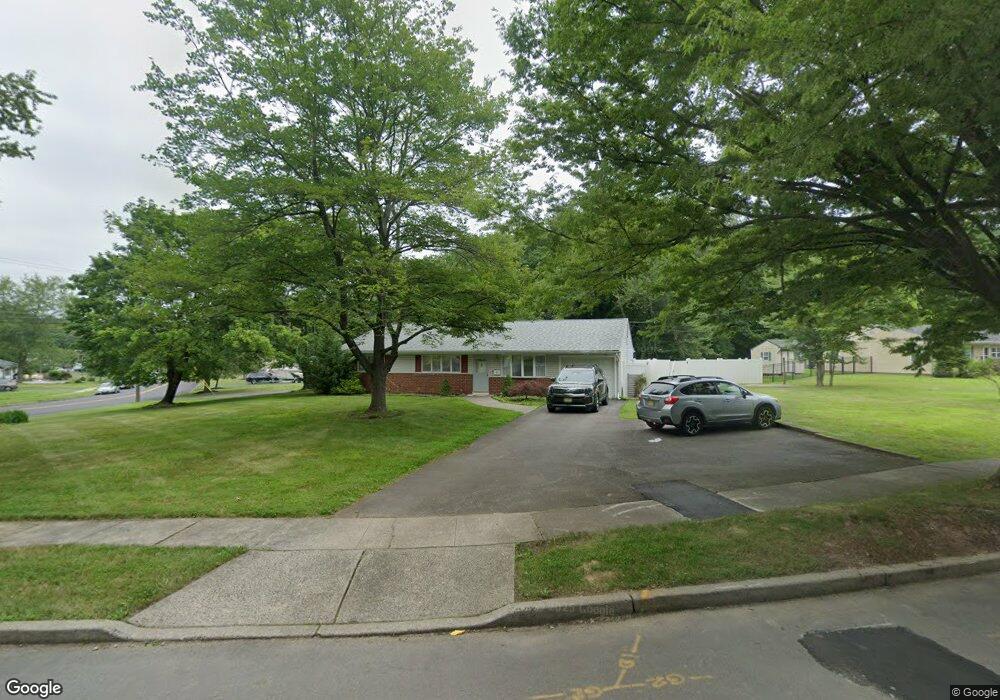
2 Halsey Rd Kendall Park, NJ 08824
Estimated Value: $549,000 - $602,000
3
Beds
2
Baths
1,505
Sq Ft
$383/Sq Ft
Est. Value
About This Home
This home is located at 2 Halsey Rd, Kendall Park, NJ 08824 and is currently estimated at $576,989, approximately $383 per square foot. 2 Halsey Rd is a home located in Middlesex County with nearby schools including Cambridge Elementary School, Crossroads South Middle School, and South Brunswick High School.
Ownership History
Date
Name
Owned For
Owner Type
Purchase Details
Closed on
Feb 1, 2018
Sold by
Ach Beechwood Ct Llc
Bought by
Masuda Lori M and Levy Sarah C
Current Estimated Value
Home Financials for this Owner
Home Financials are based on the most recent Mortgage that was taken out on this home.
Original Mortgage
$346,750
Outstanding Balance
$294,034
Interest Rate
4.04%
Mortgage Type
New Conventional
Estimated Equity
$282,955
Purchase Details
Closed on
Apr 19, 2017
Sold by
Christiana Trust
Bought by
Ach Beechwood Ct Llc
Purchase Details
Closed on
May 13, 2015
Sold by
Stanford Edward G and Stanford Linda
Bought by
Countrywide Home Loans Inc
Purchase Details
Closed on
Nov 15, 1999
Sold by
Tucker David
Bought by
Stanford Edward
Home Financials for this Owner
Home Financials are based on the most recent Mortgage that was taken out on this home.
Original Mortgage
$159,000
Interest Rate
7.71%
Mortgage Type
FHA
Create a Home Valuation Report for This Property
The Home Valuation Report is an in-depth analysis detailing your home's value as well as a comparison with similar homes in the area
Home Values in the Area
Average Home Value in this Area
Purchase History
| Date | Buyer | Sale Price | Title Company |
|---|---|---|---|
| Masuda Lori M | $365,000 | Vintage Title Services Llc | |
| Ach Beechwood Ct Llc | $246,919 | Premium Title Services Inc | |
| Countrywide Home Loans Inc | $226,000 | None Available | |
| Stanford Edward | $160,000 | -- |
Source: Public Records
Mortgage History
| Date | Status | Borrower | Loan Amount |
|---|---|---|---|
| Open | Masuda Lori M | $346,750 | |
| Previous Owner | Stanford Edward | $159,000 |
Source: Public Records
Tax History Compared to Growth
Tax History
| Year | Tax Paid | Tax Assessment Tax Assessment Total Assessment is a certain percentage of the fair market value that is determined by local assessors to be the total taxable value of land and additions on the property. | Land | Improvement |
|---|---|---|---|---|
| 2025 | $8,381 | $153,900 | $77,300 | $76,600 |
| 2024 | $8,069 | $153,900 | $77,300 | $76,600 |
| 2023 | $8,069 | $153,700 | $77,300 | $76,400 |
| 2022 | $7,833 | $153,700 | $77,300 | $76,400 |
| 2021 | $7,876 | $153,700 | $77,300 | $76,400 |
| 2020 | $7,876 | $153,700 | $77,300 | $76,400 |
| 2019 | $7,945 | $153,700 | $77,300 | $76,400 |
| 2018 | $7,470 | $149,400 | $77,300 | $72,100 |
| 2017 | $7,458 | $149,400 | $77,300 | $72,100 |
| 2016 | $7,379 | $149,400 | $77,300 | $72,100 |
| 2015 | $7,155 | $149,400 | $77,300 | $72,100 |
| 2014 | $7,040 | $149,400 | $77,300 | $72,100 |
Source: Public Records
Map
Nearby Homes