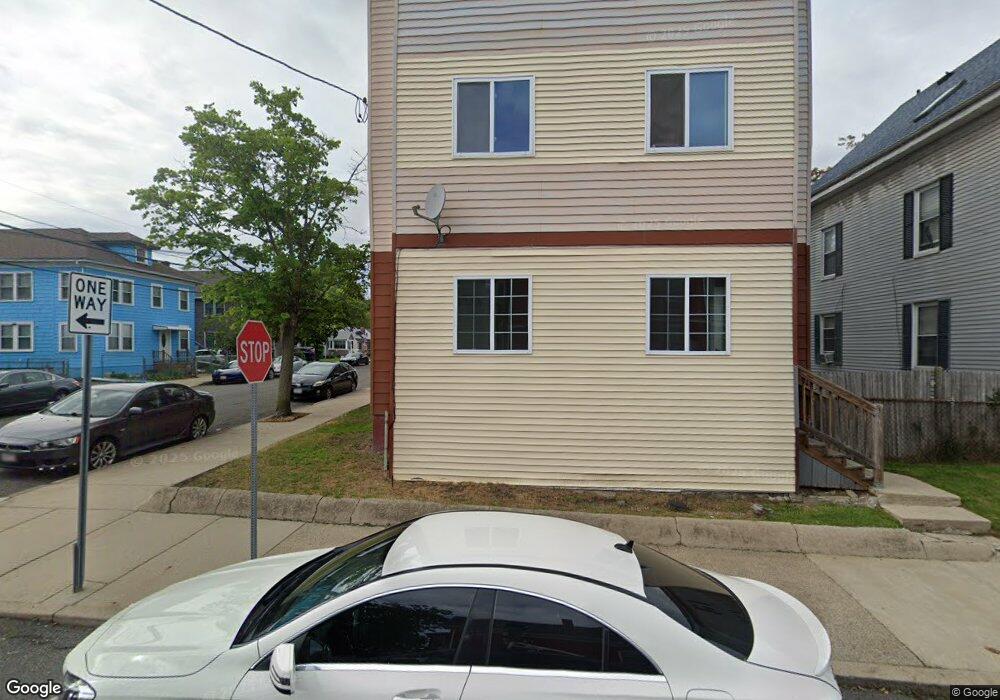
2 Hart St Lynn, MA 01905
Lower Boston Street NeighborhoodEstimated Value: $903,000 - $1,132,000
6
Beds
3
Baths
4,074
Sq Ft
$248/Sq Ft
Est. Value
About This Home
This home is located at 2 Hart St, Lynn, MA 01905 and is currently estimated at $1,010,000, approximately $247 per square foot. 2 Hart St is a home located in Essex County with nearby schools including North Park Elementary School, William R. Fallon School, and Lincoln-Thomson Elementary School.
Ownership History
Date
Name
Owned For
Owner Type
Purchase Details
Closed on
Dec 15, 2020
Sold by
Scanlon John J
Bought by
Scanlon Rt
Current Estimated Value
Purchase Details
Closed on
Nov 1, 1995
Sold by
Shorewood Fncl Inc
Bought by
Tang Chor T
Home Financials for this Owner
Home Financials are based on the most recent Mortgage that was taken out on this home.
Original Mortgage
$62,400
Interest Rate
7.58%
Mortgage Type
Purchase Money Mortgage
Purchase Details
Closed on
Apr 26, 1995
Sold by
Nicolo Peter S and Shorewood Financial In
Bought by
Shorewood Financial In
Create a Home Valuation Report for This Property
The Home Valuation Report is an in-depth analysis detailing your home's value as well as a comparison with similar homes in the area
Home Values in the Area
Average Home Value in this Area
Purchase History
| Date | Buyer | Sale Price | Title Company |
|---|---|---|---|
| Scanlon Rt | -- | None Available | |
| Scanlon Rt | -- | None Available | |
| Scanlon Rt | -- | None Available | |
| Tang Chor T | $62,500 | -- | |
| Tang Chor T | $62,500 | -- | |
| Shorewood Financial In | $212,579 | -- | |
| Shorewood Financial In | $212,579 | -- |
Source: Public Records
Mortgage History
| Date | Status | Borrower | Loan Amount |
|---|---|---|---|
| Previous Owner | Shorewood Financial In | $308,000 | |
| Previous Owner | Shorewood Financial In | $62,400 |
Source: Public Records
Tax History Compared to Growth
Tax History
| Year | Tax Paid | Tax Assessment Tax Assessment Total Assessment is a certain percentage of the fair market value that is determined by local assessors to be the total taxable value of land and additions on the property. | Land | Improvement |
|---|---|---|---|---|
| 2025 | $8,911 | $860,100 | $198,200 | $661,900 |
| 2024 | $8,836 | $839,100 | $184,300 | $654,800 |
| 2023 | $8,796 | $788,900 | $203,800 | $585,100 |
| 2022 | $8,457 | $680,400 | $156,100 | $524,300 |
| 2021 | $7,982 | $612,600 | $134,800 | $477,800 |
| 2020 | $7,744 | $577,900 | $138,300 | $439,600 |
| 2019 | $7,466 | $522,100 | $123,600 | $398,500 |
| 2018 | $6,822 | $450,300 | $111,400 | $338,900 |
| 2017 | $6,490 | $416,000 | $97,600 | $318,400 |
| 2016 | $6,064 | $374,800 | $89,800 | $285,000 |
| 2015 | $5,643 | $336,900 | $92,400 | $244,500 |
Source: Public Records
Map
Nearby Homes
- 505-507 Boston St
- 93 Robinson St
- 447 Boston St
- 28 Wyman St
- 92-94 Newton Ave
- 10 Carnes St
- 14 Atkinson St
- 20 Murray St
- 75 Moulton St
- 268 Walnut St
- 40 Grove St
- 39 Centre St
- 19 Hood St
- 693 Western Ave Unit 101
- 100 Ashland St
- 110 Holyoke St
- 662-664 Western Ave
- 11 Linwood Rd
- 35 Curran Rd
- 45 Cottage St Unit 3