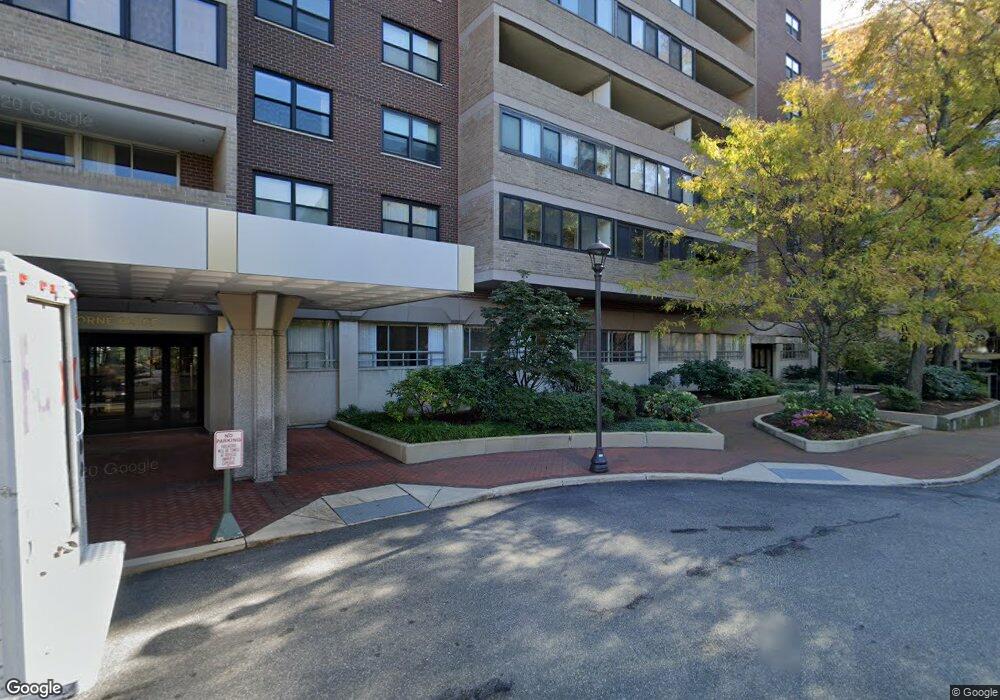
Hawthorne Place Condominium 2 Hawthorne Place Unit 16K Boston, MA 02114
West End NeighborhoodEstimated Value: $452,246 - $554,000
1
Bed
1
Bath
637
Sq Ft
$762/Sq Ft
Est. Value
About This Home
This home is located at 2 Hawthorne Place Unit 16K, Boston, MA 02114 and is currently estimated at $485,562, approximately $762 per square foot. 2 Hawthorne Place Unit 16K is a home located in Suffolk County with nearby schools including Torit Montessori School, Boston Children's School, and Advent School.
Ownership History
Date
Name
Owned For
Owner Type
Purchase Details
Closed on
Oct 15, 2013
Sold by
Boland Genevieve M and Steigman Michael
Bought by
Wu Anette and Wu Kana
Current Estimated Value
Purchase Details
Closed on
May 1, 2006
Sold by
Schemmer Ann B
Bought by
Boland Genevieve M
Home Financials for this Owner
Home Financials are based on the most recent Mortgage that was taken out on this home.
Original Mortgage
$220,000
Interest Rate
6.4%
Mortgage Type
Purchase Money Mortgage
Purchase Details
Closed on
Jul 2, 1998
Sold by
Kulbaski Rebecca
Bought by
Schemmer John A and Schemmer Ann B
Purchase Details
Closed on
May 25, 1990
Sold by
Markowitz Jerome
Bought by
Kulbaski Frank
Home Financials for this Owner
Home Financials are based on the most recent Mortgage that was taken out on this home.
Original Mortgage
$94,000
Interest Rate
10.13%
Mortgage Type
Purchase Money Mortgage
Create a Home Valuation Report for This Property
The Home Valuation Report is an in-depth analysis detailing your home's value as well as a comparison with similar homes in the area
Home Values in the Area
Average Home Value in this Area
Purchase History
| Date | Buyer | Sale Price | Title Company |
|---|---|---|---|
| Wu Anette | $327,000 | -- | |
| Boland Genevieve M | $300,000 | -- | |
| Schemmer John A | $109,500 | -- | |
| Kulbaski Frank | $94,000 | -- |
Source: Public Records
Mortgage History
| Date | Status | Borrower | Loan Amount |
|---|---|---|---|
| Previous Owner | Kulbaski Frank | $214,000 | |
| Previous Owner | Boland Genevieve M | $220,000 | |
| Previous Owner | Kulbaski Frank | $94,000 |
Source: Public Records
Tax History Compared to Growth
Tax History
| Year | Tax Paid | Tax Assessment Tax Assessment Total Assessment is a certain percentage of the fair market value that is determined by local assessors to be the total taxable value of land and additions on the property. | Land | Improvement |
|---|---|---|---|---|
| 2025 | $4,923 | $425,100 | $0 | $425,100 |
| 2024 | $4,762 | $436,900 | $0 | $436,900 |
| 2023 | $4,692 | $436,900 | $0 | $436,900 |
| 2022 | $4,707 | $432,600 | $0 | $432,600 |
| 2021 | $4,616 | $432,600 | $0 | $432,600 |
| 2020 | $4,613 | $436,800 | $0 | $436,800 |
| 2019 | $4,384 | $415,900 | $0 | $415,900 |
| 2018 | $4,113 | $392,500 | $0 | $392,500 |
| 2017 | $3,956 | $373,600 | $0 | $373,600 |
| 2016 | $3,841 | $349,200 | $0 | $349,200 |
| 2015 | $3,746 | $309,302 | $0 | $309,302 |
| 2014 | $3,603 | $286,391 | $0 | $286,391 |
Source: Public Records
About Hawthorne Place Condominium
Map
Nearby Homes
- 2 Hawthorne Place Unit 5H
- 9 Hawthorne Place
- 9 Hawthorne Place Unit 7O
- 9 Hawthorne Place Unit 5K
- 2-9 Hawthorne Place Pkg Sp 1
- 6 Whittier Place Unit 9E
- 6 Whittier Place Unit 7E
- 6 Whittier Place Unit 9H
- 6 Whittier Place Unit 14N&O
- 8 Whittier Place Unit 21E
- 150 Staniford St Unit 1009
- 150 Staniford St Unit 704
- 9 Hancock St Unit 5
- 14 Temple St Unit 14
- 9 Bowdoin St
- 6 Strong Place
- 12 Grove St
- 13 Bowdoin St Unit 3AB
- 121-127 Portland St Unit 202
- 121 Portland St Unit 605
- 2 Hawthorne Place Unit 8P
- 2 Hawthorne Place Unit 7o
- 2 Hawthorne Place Unit 4H
- 2 Hawthorne Place Unit 14C
- 2 Hawthorne Place Unit 5K
- 2 Hawthorne Place Unit 15M
- 2 Hawthorne Place Unit 14N
- 2 Hawthorne Place Unit 16F
- 2 Hawthorne Place Unit 5B
- 2 Hawthorne Place Unit 14L
- 2 Hawthorne Place Unit 16L
- 2 Hawthorne Place Unit 15-f
- 2 Hawthorne Place Unit 9 D
- 2 Hawthorne Place Unit 6R
- 2 Hawthorne Place Unit 11F
- 2 Hawthorne Place Unit 4J
- 2 Hawthorne Place Unit 15R
- 2 Hawthorne Place Unit 9H
- 2 Hawthorne Place Unit 11D
- 2 Hawthorne Place Unit 4B