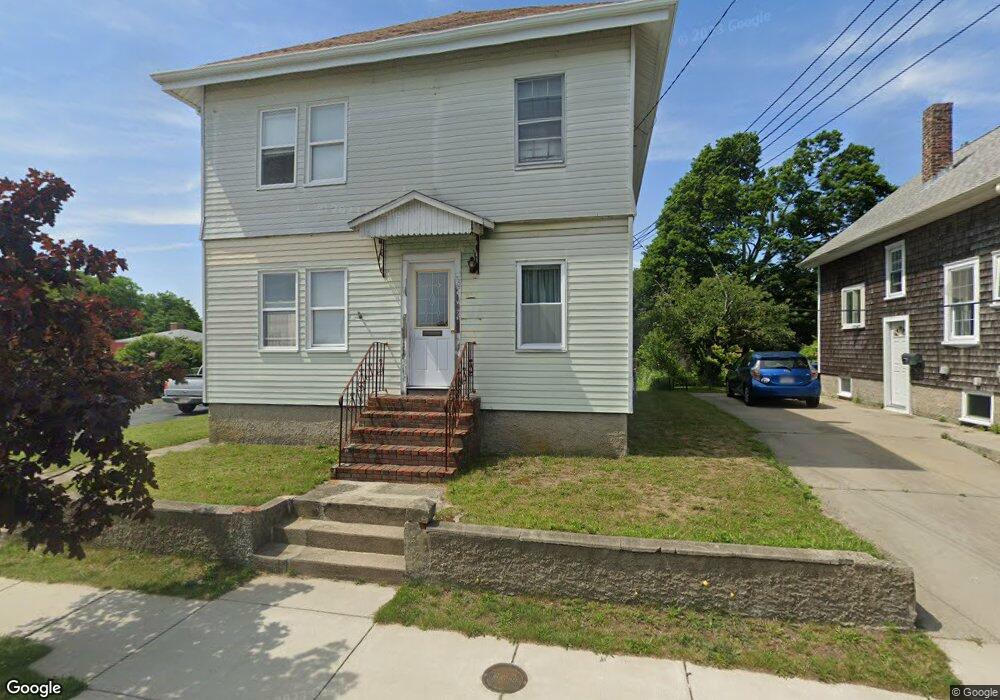
2 Hedge St Fairhaven, MA 02719
Oxford NeighborhoodEstimated Value: $632,000 - $811,000
5
Beds
2
Baths
2,440
Sq Ft
$291/Sq Ft
Est. Value
About This Home
This home is located at 2 Hedge St, Fairhaven, MA 02719 and is currently estimated at $710,988, approximately $291 per square foot. 2 Hedge St is a home located in Bristol County with nearby schools including Fairhaven High School, Alma Del Mar Charter School, and City On A Hill Charter Public School New Bedford.
Ownership History
Date
Name
Owned For
Owner Type
Purchase Details
Closed on
Apr 19, 2012
Sold by
Fournier John L and Fournier Elaine
Bought by
Fournier John L
Current Estimated Value
Home Financials for this Owner
Home Financials are based on the most recent Mortgage that was taken out on this home.
Original Mortgage
$330,000
Outstanding Balance
$224,438
Interest Rate
3.89%
Mortgage Type
New Conventional
Estimated Equity
$486,550
Purchase Details
Closed on
Jan 13, 1992
Sold by
Susi Dante J and Susi Clarisse
Bought by
Fournier John L and Fournier Elaine D
Home Financials for this Owner
Home Financials are based on the most recent Mortgage that was taken out on this home.
Original Mortgage
$100,800
Interest Rate
8.64%
Mortgage Type
Purchase Money Mortgage
Create a Home Valuation Report for This Property
The Home Valuation Report is an in-depth analysis detailing your home's value as well as a comparison with similar homes in the area
Home Values in the Area
Average Home Value in this Area
Purchase History
| Date | Buyer | Sale Price | Title Company |
|---|---|---|---|
| Fournier John L | $70,000 | -- | |
| Fournier John L | $112,000 | -- |
Source: Public Records
Mortgage History
| Date | Status | Borrower | Loan Amount |
|---|---|---|---|
| Open | Fournier John L | $330,000 | |
| Previous Owner | Fournier John L | $100,800 | |
| Previous Owner | Fournier John L | $70,000 |
Source: Public Records
Tax History
| Year | Tax Paid | Tax Assessment Tax Assessment Total Assessment is a certain percentage of the fair market value that is determined by local assessors to be the total taxable value of land and additions on the property. | Land | Improvement |
|---|---|---|---|---|
| 2025 | $60 | $647,000 | $452,300 | $194,700 |
| 2024 | $5,709 | $618,500 | $430,500 | $188,000 |
| 2023 | $5,406 | $543,300 | $369,200 | $174,100 |
| 2022 | $5,432 | $531,500 | $369,200 | $162,300 |
| 2021 | $4,081 | $492,200 | $354,200 | $138,000 |
| 2020 | $5,444 | $492,200 | $354,200 | $138,000 |
| 2019 | $3,310 | $435,600 | $292,900 | $142,700 |
| 2018 | $6,626 | $426,800 | $292,900 | $133,900 |
| 2017 | $6,649 | $415,500 | $292,900 | $122,600 |
| 2016 | $4,927 | $404,500 | $292,900 | $111,600 |
| 2015 | $4,550 | $374,500 | $265,600 | $108,900 |
Source: Public Records
Map
Nearby Homes
- 61 Oxford St
- 14 Sycamore St
- 442 Dana Farms
- 24 Academy Ave
- 313 Main St
- 253 Adams St
- 138 Main St Unit 13
- 10 Livesey Pkwy
- 71 Sycamore St
- 34 Washburn St Unit 36
- 15 School St
- 16 Ash St
- 24 Cotter St
- 67 Bridge St
- 48 Bellevue St
- 1301 Pleasant St Unit 1305
- 39 Christian St
- 239 Sawyer St
- 17 Campbell St
- 216 State St
Your Personal Tour Guide
Ask me questions while you tour the home.