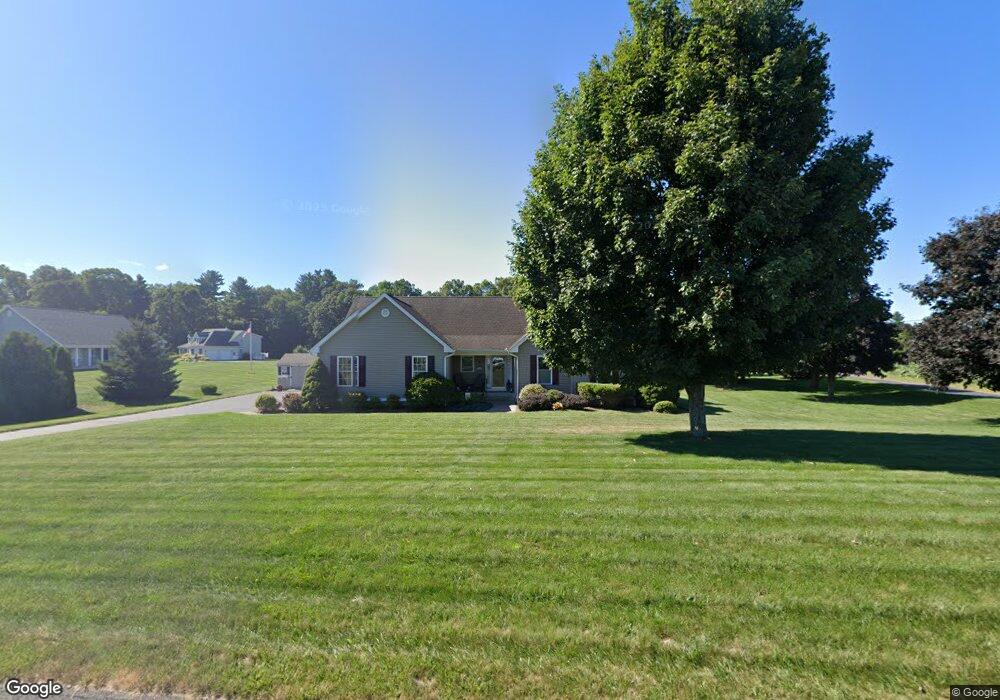
2 Hemlock Ct Broad Brook, CT 06016
Estimated Value: $507,000 - $725,000
3
Beds
2
Baths
1,874
Sq Ft
$309/Sq Ft
Est. Value
About This Home
This home is located at 2 Hemlock Ct, Broad Brook, CT 06016 and is currently estimated at $578,349, approximately $308 per square foot. 2 Hemlock Ct is a home located in Hartford County with nearby schools including Broad Brook Elementary School, East Windsor Middle School, and East Windsor High School.
Ownership History
Date
Name
Owned For
Owner Type
Purchase Details
Closed on
May 3, 2010
Sold by
Christopher Douglas and Christopher Patricia
Bought by
Buddenhagen Gary and Buddenhagen Janet
Current Estimated Value
Home Financials for this Owner
Home Financials are based on the most recent Mortgage that was taken out on this home.
Original Mortgage
$185,000
Outstanding Balance
$123,633
Interest Rate
4.99%
Estimated Equity
$454,716
Purchase Details
Closed on
Aug 31, 2005
Sold by
Superior Bldrs Inc
Bought by
Christopher Patricia and Christopher Douglas
Home Financials for this Owner
Home Financials are based on the most recent Mortgage that was taken out on this home.
Original Mortgage
$250,000
Interest Rate
5.81%
Purchase Details
Closed on
Jul 29, 2005
Sold by
Melrose-Hemlock Ct Llc
Bought by
Superior Bldrs
Home Financials for this Owner
Home Financials are based on the most recent Mortgage that was taken out on this home.
Original Mortgage
$250,000
Interest Rate
5.81%
Create a Home Valuation Report for This Property
The Home Valuation Report is an in-depth analysis detailing your home's value as well as a comparison with similar homes in the area
Home Values in the Area
Average Home Value in this Area
Purchase History
| Date | Buyer | Sale Price | Title Company |
|---|---|---|---|
| Buddenhagen Gary | $355,000 | -- | |
| Christopher Patricia | $318,880 | -- | |
| Superior Bldrs | $80,000 | -- |
Source: Public Records
Mortgage History
| Date | Status | Borrower | Loan Amount |
|---|---|---|---|
| Open | Superior Bldrs | $185,000 | |
| Previous Owner | Superior Bldrs | $10,100 | |
| Previous Owner | Superior Bldrs | $250,000 |
Source: Public Records
Tax History
| Year | Tax Paid | Tax Assessment Tax Assessment Total Assessment is a certain percentage of the fair market value that is determined by local assessors to be the total taxable value of land and additions on the property. | Land | Improvement |
|---|---|---|---|---|
| 2025 | $7,656 | $289,000 | $81,760 | $207,240 |
| 2024 | $7,098 | $289,000 | $81,760 | $207,240 |
| 2023 | $6,565 | $191,520 | $70,800 | $120,720 |
| 2022 | $6,692 | $191,520 | $70,800 | $120,720 |
| 2021 | $6,607 | $191,520 | $70,800 | $120,720 |
| 2020 | $6,650 | $191,520 | $70,800 | $120,720 |
| 2019 | $6,560 | $191,520 | $70,800 | $120,720 |
| 2018 | $6,493 | $191,520 | $70,800 | $120,720 |
| 2017 | $7,245 | $221,090 | $83,280 | $137,810 |
| 2016 | $6,838 | $221,090 | $83,280 | $137,810 |
| 2015 | $6,701 | $221,090 | $83,280 | $137,810 |
| 2014 | $6,584 | $221,090 | $83,280 | $137,810 |
Source: Public Records
Map
Nearby Homes
- 30 Broadbrook Rd
- 26 Hillside Farms Dr
- 298 Broadbrook Rd
- 160 East Rd
- 164 East Rd
- 40 Sapphire St
- 13 Reservoir Ave
- 4 Rye St
- 111 Old Ellington Rd
- 9 Brockway Rd
- 183 Chamberlain Rd
- 33 Harrington Rd
- 96 Muddy Brook Rd
- 77 Thrall Rd
- 7 Bobolink Ln
- 196 Jobs Hill Rd
- 0 Wells Rd
- 27 Folkstone Rd Unit C
- 22 Sadds Mill Rd
- 24 Iroquois Rd
Your Personal Tour Guide
Ask me questions while you tour the home.