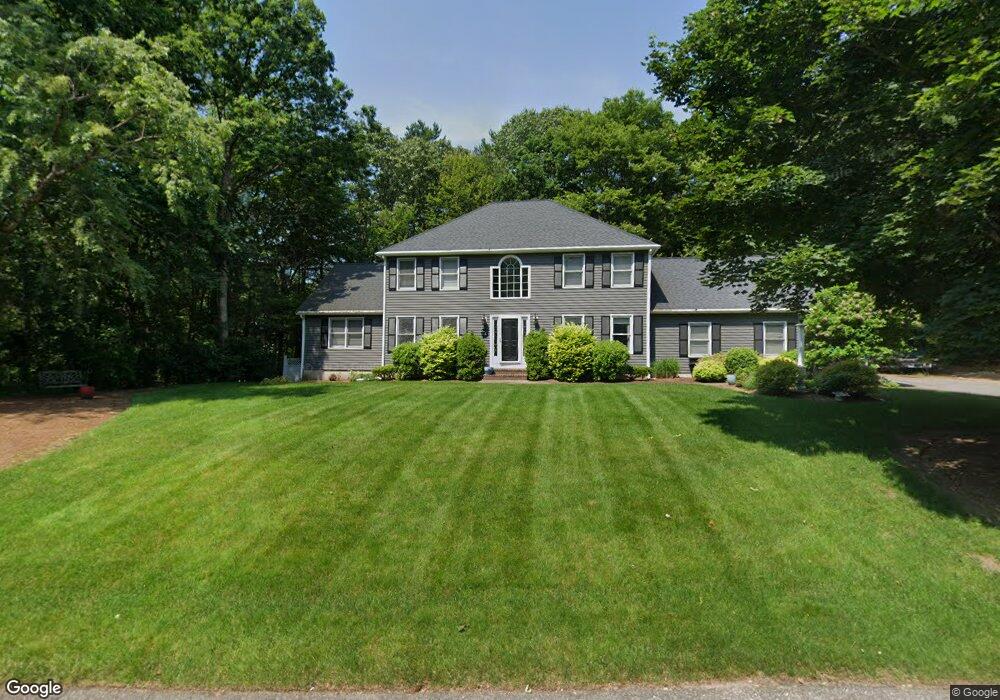
2 Hemlock Ln North Easton, MA 02356
Estimated Value: $829,000 - $878,000
3
Beds
3
Baths
2,308
Sq Ft
$369/Sq Ft
Est. Value
About This Home
This home is located at 2 Hemlock Ln, North Easton, MA 02356 and is currently estimated at $852,259, approximately $369 per square foot. 2 Hemlock Ln is a home located in Bristol County with nearby schools including Easton Middle School and Oliver Ames High School.
Ownership History
Date
Name
Owned For
Owner Type
Purchase Details
Closed on
Dec 14, 1994
Sold by
Stonebridge Rt
Bought by
Rose Jeffrey E and Rose Tracey E
Current Estimated Value
Home Financials for this Owner
Home Financials are based on the most recent Mortgage that was taken out on this home.
Original Mortgage
$151,000
Interest Rate
9.03%
Mortgage Type
Purchase Money Mortgage
Create a Home Valuation Report for This Property
The Home Valuation Report is an in-depth analysis detailing your home's value as well as a comparison with similar homes in the area
Home Values in the Area
Average Home Value in this Area
Purchase History
| Date | Buyer | Sale Price | Title Company |
|---|---|---|---|
| Rose Jeffrey E | $219,900 | -- | |
| Rose Jeffrey E | $219,900 | -- |
Source: Public Records
Mortgage History
| Date | Status | Borrower | Loan Amount |
|---|---|---|---|
| Open | Rose Jeffrey E | $336,000 | |
| Closed | Rose Jeffrey E | $146,000 | |
| Closed | Rose Jeffrey E | $151,000 |
Source: Public Records
Tax History Compared to Growth
Tax History
| Year | Tax Paid | Tax Assessment Tax Assessment Total Assessment is a certain percentage of the fair market value that is determined by local assessors to be the total taxable value of land and additions on the property. | Land | Improvement |
|---|---|---|---|---|
| 2025 | $9,338 | $748,200 | $401,300 | $346,900 |
| 2024 | $8,699 | $651,600 | $305,600 | $346,000 |
| 2023 | $8,608 | $590,000 | $297,500 | $292,500 |
| 2022 | $8,437 | $548,200 | $266,600 | $281,600 |
| 2021 | $8,293 | $535,700 | $254,100 | $281,600 |
| 2020 | $8,041 | $522,800 | $249,300 | $273,500 |
| 2019 | $7,862 | $492,600 | $226,300 | $266,300 |
| 2018 | $7,711 | $475,700 | $226,300 | $249,400 |
| 2017 | $7,443 | $458,900 | $226,300 | $232,600 |
| 2016 | $7,247 | $447,600 | $226,300 | $221,300 |
| 2015 | $7,271 | $433,300 | $212,000 | $221,300 |
| 2014 | $6,860 | $412,000 | $193,500 | $218,500 |
Source: Public Records
Map
Nearby Homes
- 32 Heritage Dr
- 114 Summer St
- 66 Poquanticut Ave
- 321 Bay Rd
- 15 Randall Farm Dr
- 81 Rockland St
- 47 Guinevere Rd
- 30 King Arthur Rd
- 25 Andrews Farm Rd
- 89 Massapoag Ave
- 45 Randall St
- 20 Quarry Ln
- 79 Summer St
- 9 Oak Ridge Dr
- 43 Matthew Cir
- 26 Gaslight Ln Unit 26
- 555 Foundry St Unit B
- 1 Newell Cir
- 531 Foundry St Unit D
- 531 Foundry St Unit C