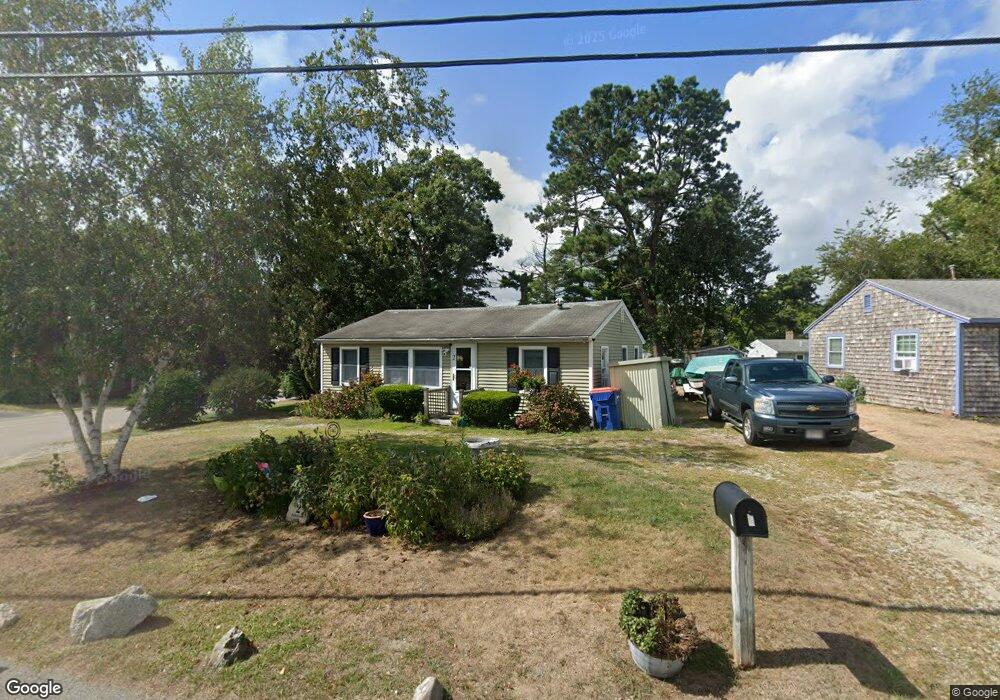
2 Hideaway Ln East Wareham, MA 02538
White Island Shores NeighborhoodEstimated Value: $358,499 - $377,000
1
Bed
1
Bath
430
Sq Ft
$849/Sq Ft
Est. Value
About This Home
This home is located at 2 Hideaway Ln, East Wareham, MA 02538 and is currently estimated at $364,875, approximately $848 per square foot. 2 Hideaway Ln is a home located in Plymouth County with nearby schools including South Elementary School, Plymouth South Middle School, and Plymouth South High School.
Ownership History
Date
Name
Owned For
Owner Type
Purchase Details
Closed on
Dec 20, 2019
Sold by
Collins Jay and Roche Rebecca
Bought by
Sarafian James and Roche Rebecca
Current Estimated Value
Home Financials for this Owner
Home Financials are based on the most recent Mortgage that was taken out on this home.
Original Mortgage
$150,000
Outstanding Balance
$131,675
Interest Rate
3.6%
Mortgage Type
New Conventional
Estimated Equity
$233,200
Purchase Details
Closed on
Oct 31, 2007
Sold by
Roche Timithy
Bought by
Collins Jay and Collins Suzanne
Home Financials for this Owner
Home Financials are based on the most recent Mortgage that was taken out on this home.
Original Mortgage
$170,000
Interest Rate
6.43%
Mortgage Type
Purchase Money Mortgage
Purchase Details
Closed on
Oct 6, 2003
Sold by
Roche Rebecca and Congdon Rebecca L
Bought by
Roche Timithy
Create a Home Valuation Report for This Property
The Home Valuation Report is an in-depth analysis detailing your home's value as well as a comparison with similar homes in the area
Home Values in the Area
Average Home Value in this Area
Purchase History
| Date | Buyer | Sale Price | Title Company |
|---|---|---|---|
| Sarafian James | -- | None Available | |
| Sarafian James | -- | None Available | |
| Collins Jay | -- | -- | |
| Collins Jay | -- | -- | |
| Roche Timithy | $165,000 | -- | |
| Roche Timithy | $165,000 | -- |
Source: Public Records
Mortgage History
| Date | Status | Borrower | Loan Amount |
|---|---|---|---|
| Open | Sarafian James | $150,000 | |
| Closed | Sarafian James | $150,000 | |
| Previous Owner | Roche Timithy | $170,000 |
Source: Public Records
Tax History
| Year | Tax Paid | Tax Assessment Tax Assessment Total Assessment is a certain percentage of the fair market value that is determined by local assessors to be the total taxable value of land and additions on the property. | Land | Improvement |
|---|---|---|---|---|
| 2025 | $3,134 | $300,800 | $106,800 | $194,000 |
| 2024 | $3,302 | $294,000 | $82,500 | $211,500 |
| 2023 | $2,859 | $260,900 | $75,000 | $185,900 |
| 2022 | $2,859 | $216,900 | $75,000 | $141,900 |
| 2021 | $2,651 | $197,100 | $75,000 | $122,100 |
| 2020 | $2,511 | $189,400 | $75,000 | $114,400 |
| 2019 | $2,253 | $169,500 | $69,500 | $100,000 |
| 2018 | $2,137 | $156,800 | $69,500 | $87,300 |
| 2017 | $2,030 | $150,900 | $69,500 | $81,400 |
| 2016 | $1,848 | $136,600 | $66,400 | $70,200 |
| 2015 | $1,785 | $136,600 | $66,400 | $70,200 |
| 2014 | $1,624 | $126,400 | $63,100 | $63,300 |
Source: Public Records
Map
Nearby Homes
Your Personal Tour Guide
Ask me questions while you tour the home.