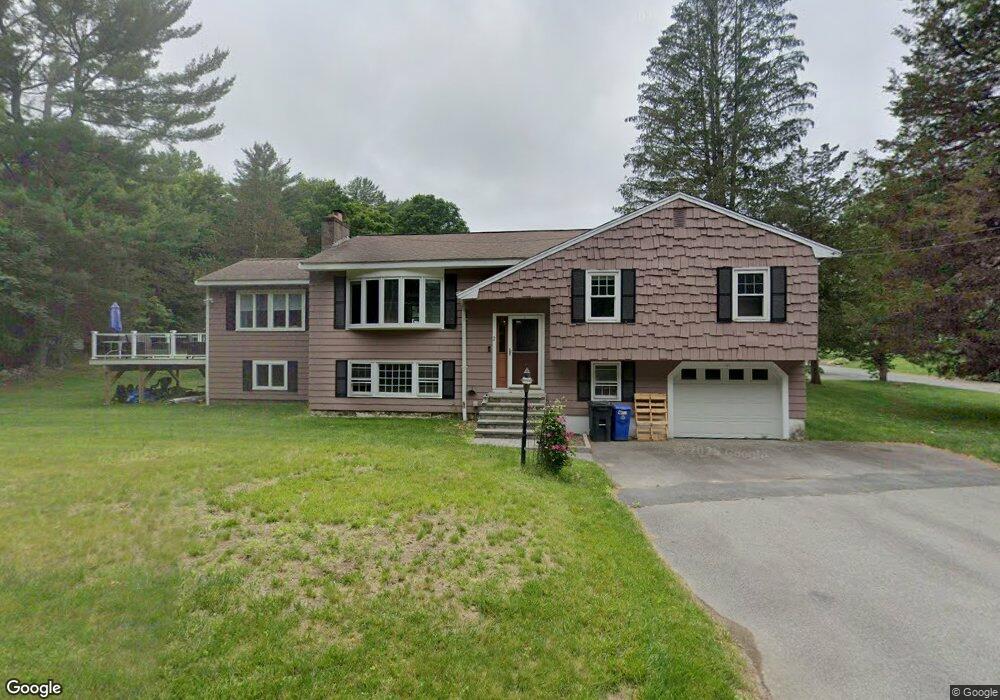
2 Hobart St Walpole, MA 02081
Estimated Value: $697,000 - $802,000
3
Beds
3
Baths
1,466
Sq Ft
$510/Sq Ft
Est. Value
About This Home
This home is located at 2 Hobart St, Walpole, MA 02081 and is currently estimated at $747,909, approximately $510 per square foot. 2 Hobart St is a home located in Norfolk County with nearby schools including Fisher School, Walpole Middle School, and Walpole High School.
Ownership History
Date
Name
Owned For
Owner Type
Purchase Details
Closed on
Nov 22, 2019
Sold by
Scannell Robert J and Scannell Sheila F
Bought by
Didomenico Sabrina V
Current Estimated Value
Home Financials for this Owner
Home Financials are based on the most recent Mortgage that was taken out on this home.
Original Mortgage
$406,750
Outstanding Balance
$357,835
Interest Rate
3.6%
Mortgage Type
New Conventional
Estimated Equity
$390,074
Purchase Details
Closed on
Feb 26, 1999
Sold by
Christy Robert D
Bought by
Scannell Robert J and Scannell Sheila F
Home Financials for this Owner
Home Financials are based on the most recent Mortgage that was taken out on this home.
Original Mortgage
$100,000
Interest Rate
6.78%
Mortgage Type
Purchase Money Mortgage
Create a Home Valuation Report for This Property
The Home Valuation Report is an in-depth analysis detailing your home's value as well as a comparison with similar homes in the area
Home Values in the Area
Average Home Value in this Area
Purchase History
| Date | Buyer | Sale Price | Title Company |
|---|---|---|---|
| Didomenico Sabrina V | $475,000 | -- | |
| Scannell Robert J | $206,500 | -- |
Source: Public Records
Mortgage History
| Date | Status | Borrower | Loan Amount |
|---|---|---|---|
| Open | Didomenico Sabrina V | $406,750 | |
| Previous Owner | Scannell Robert J | $100,000 |
Source: Public Records
Tax History
| Year | Tax Paid | Tax Assessment Tax Assessment Total Assessment is a certain percentage of the fair market value that is determined by local assessors to be the total taxable value of land and additions on the property. | Land | Improvement |
|---|---|---|---|---|
| 2025 | $8,314 | $648,000 | $364,800 | $283,200 |
| 2024 | $8,134 | $615,300 | $350,700 | $264,600 |
| 2023 | $7,695 | $554,000 | $305,000 | $249,000 |
| 2022 | $7,291 | $504,200 | $282,500 | $221,700 |
| 2021 | $7,019 | $473,000 | $266,500 | $206,500 |
| 2020 | $6,843 | $456,500 | $251,400 | $205,100 |
| 2019 | $6,599 | $437,000 | $241,800 | $195,200 |
| 2018 | $6,339 | $415,100 | $233,100 | $182,000 |
| 2017 | $6,126 | $399,600 | $224,100 | $175,500 |
| 2016 | $5,959 | $383,000 | $215,400 | $167,600 |
| 2015 | $5,727 | $364,800 | $205,100 | $159,700 |
| 2014 | $5,391 | $342,100 | $205,100 | $137,000 |
Source: Public Records
Map
Nearby Homes
- 241 Fisher St
- 16 Albemarle Rd
- 26 Albemarle Rd
- 291 Plimpton St
- 19 and 23 Arlington Ln
- 5 Endicott St Unit 3
- 26 Dover Dr
- 41 Gill St Unit A
- 40 Endean Dr
- 246 Pemberton St
- 70 Endicott St Unit 401
- 70 Endicott St Unit 701
- 65 Alandale Pkwy
- 56 North St
- 74 Alandale Pkwy
- 53 Tremont St
- 15 Atwood Ave
- 7 Atwood Ave
- 5 Atwood Ave
- 486 Washington St
Your Personal Tour Guide
Ask me questions while you tour the home.