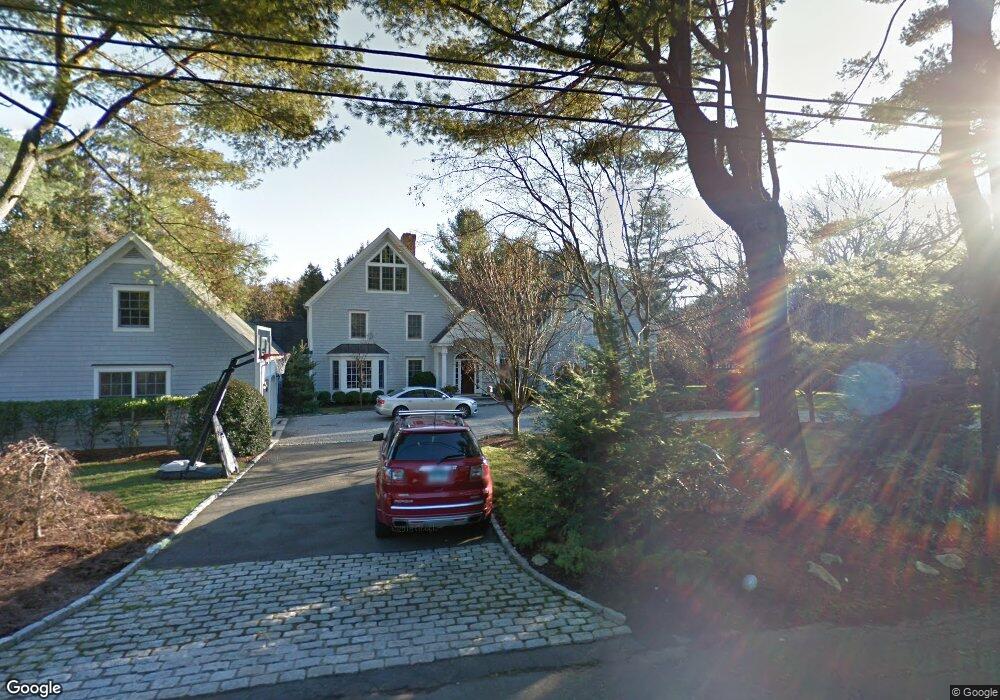
2 Hockanum Rd Westport, CT 06880
Coleytown NeighborhoodEstimated Value: $3,013,699 - $3,702,000
5
Beds
6
Baths
6,000
Sq Ft
$579/Sq Ft
Est. Value
About This Home
This home is located at 2 Hockanum Rd, Westport, CT 06880 and is currently estimated at $3,475,175, approximately $579 per square foot. 2 Hockanum Rd is a home located in Fairfield County with nearby schools including Coleytown Elementary School, Coleytown Middle School, and Staples High School.
Ownership History
Date
Name
Owned For
Owner Type
Purchase Details
Closed on
Jul 8, 2011
Sold by
Stirton Kerry J and Wilson Mary M
Bought by
Geismann Todd P and Geismann Heather T
Current Estimated Value
Home Financials for this Owner
Home Financials are based on the most recent Mortgage that was taken out on this home.
Original Mortgage
$1,260,000
Interest Rate
3%
Purchase Details
Closed on
Apr 5, 2007
Sold by
Leger J Albert and Ufford-Leger Eleanor
Bought by
Stirton Kerry J and Wilson Mary M
Purchase Details
Closed on
Jul 16, 2001
Sold by
Maybruck Monica
Bought by
Ufford-Leger Eleanor and Leger Albert
Purchase Details
Closed on
Jun 21, 1993
Sold by
Hyman Enid and Lipkowitz Nina
Bought by
Maybruck Richard and Maybruck Monica
Create a Home Valuation Report for This Property
The Home Valuation Report is an in-depth analysis detailing your home's value as well as a comparison with similar homes in the area
Home Values in the Area
Average Home Value in this Area
Purchase History
| Date | Buyer | Sale Price | Title Company |
|---|---|---|---|
| Geismann Todd P | $1,800,000 | -- | |
| Geismann Todd P | $1,800,000 | -- | |
| Stirton Kerry J | $1,750,000 | -- | |
| Stirton Kerry J | $1,750,000 | -- | |
| Ufford-Leger Eleanor | $930,000 | -- | |
| Ufford-Leger Eleanor | $930,000 | -- | |
| Maybruck Richard | $488,500 | -- | |
| Maybruck Richard | $488,500 | -- |
Source: Public Records
Mortgage History
| Date | Status | Borrower | Loan Amount |
|---|---|---|---|
| Open | Maybruck Richard | $1,405,060 | |
| Closed | Geismann Todd P | $1,260,000 |
Source: Public Records
Tax History Compared to Growth
Tax History
| Year | Tax Paid | Tax Assessment Tax Assessment Total Assessment is a certain percentage of the fair market value that is determined by local assessors to be the total taxable value of land and additions on the property. | Land | Improvement |
|---|---|---|---|---|
| 2025 | $24,222 | $1,284,300 | $417,500 | $866,800 |
| 2024 | $23,914 | $1,284,300 | $417,500 | $866,800 |
| 2023 | $23,536 | $1,282,600 | $417,500 | $865,100 |
| 2022 | $23,177 | $1,282,600 | $417,500 | $865,100 |
| 2021 | $23,177 | $1,282,600 | $417,500 | $865,100 |
| 2020 | $21,910 | $1,395,400 | $439,600 | $955,800 |
| 2019 | $5,902 | $1,395,400 | $439,600 | $955,800 |
| 2018 | $5,989 | $1,395,400 | $439,600 | $955,800 |
| 2017 | $23,526 | $1,395,400 | $439,600 | $955,800 |
| 2016 | $23,526 | $1,395,400 | $439,600 | $955,800 |
| 2015 | $23,450 | $1,296,300 | $365,900 | $930,400 |
| 2014 | $22,298 | $1,242,900 | $365,900 | $877,000 |
Source: Public Records
Map
Nearby Homes
- 53 Cross Hwy
- 489 Main St
- 3 Ln
- 26 Hitchcock Rd
- 15 Cross Hwy
- 3 Hickory Hill Rd
- 21 Warnock Dr
- 17 Clover Ln
- 24 Warnock Dr
- 19 Joann Cir
- 41 Richmondville Ave Unit 104
- 41 Richmondville Ave Unit Duplex 2
- 41 Richmondville Ave Unit 303
- 41 Richmondville Ave Unit 111
- 41 Richmondville Ave Unit 101
- 41 Richmondville Ave Unit 105
- 7 Wild Rose Rd
- 19A Darbrook Rd
- 310 Main St
- 26 Cob Dr