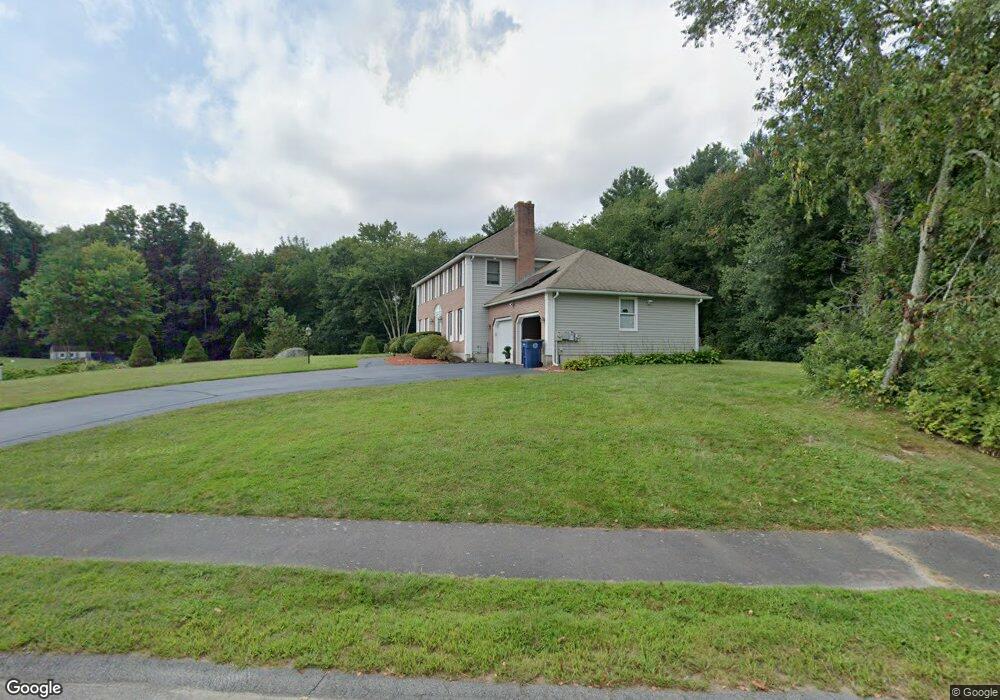
2 Holbrook St Medway, MA 02053
Estimated Value: $765,809 - $1,074,000
4
Beds
3
Baths
2,497
Sq Ft
$367/Sq Ft
Est. Value
About This Home
This home is located at 2 Holbrook St, Medway, MA 02053 and is currently estimated at $915,202, approximately $366 per square foot. 2 Holbrook St is a home located in Norfolk County with nearby schools including John D. McGovern Elementary School, Burke-Memorial Elementary, and Medway Middle School.
Ownership History
Date
Name
Owned For
Owner Type
Purchase Details
Closed on
May 30, 1997
Sold by
Cooper Michael G
Bought by
Piascik Thomas W and Piascik Janet C
Current Estimated Value
Purchase Details
Closed on
Jun 28, 1996
Sold by
Hudson Charles D and Hudson Anna L
Bought by
Cooper Michael G
Create a Home Valuation Report for This Property
The Home Valuation Report is an in-depth analysis detailing your home's value as well as a comparison with similar homes in the area
Home Values in the Area
Average Home Value in this Area
Purchase History
| Date | Buyer | Sale Price | Title Company |
|---|---|---|---|
| Piascik Thomas W | $255,000 | -- | |
| Cooper Michael G | $238,500 | -- |
Source: Public Records
Mortgage History
| Date | Status | Borrower | Loan Amount |
|---|---|---|---|
| Open | Cooper Michael G | $341,600 | |
| Closed | Cooper Michael G | $255,000 |
Source: Public Records
Tax History Compared to Growth
Tax History
| Year | Tax Paid | Tax Assessment Tax Assessment Total Assessment is a certain percentage of the fair market value that is determined by local assessors to be the total taxable value of land and additions on the property. | Land | Improvement |
|---|---|---|---|---|
| 2025 | $9,426 | $661,500 | $323,600 | $337,900 |
| 2024 | $9,526 | $661,500 | $323,600 | $337,900 |
| 2023 | $9,491 | $595,400 | $294,600 | $300,800 |
| 2022 | $8,485 | $501,200 | $217,800 | $283,400 |
| 2021 | $8,503 | $487,000 | $203,300 | $283,700 |
| 2020 | $8,335 | $476,300 | $203,300 | $273,000 |
| 2019 | $7,871 | $463,800 | $195,000 | $268,800 |
| 2018 | $7,931 | $449,100 | $186,700 | $262,400 |
| 2017 | $7,896 | $440,600 | $182,500 | $258,100 |
| 2016 | $7,717 | $426,100 | $168,000 | $258,100 |
| 2015 | $7,674 | $420,700 | $165,900 | $254,800 |
| 2014 | $7,868 | $417,600 | $165,900 | $251,700 |
Source: Public Records
Map
Nearby Homes
- 39 West St
- 9 Tulip Way
- 22 Granite St
- 6 Rainbow Dr
- 4 Deerfield Rd
- 462 Hartford Ave
- 0 Old Log Lane (Farm St) Unit 73416329
- 455 Hartford Ave
- 78 Fisher St
- 6 Freedom Trail
- 85 Fisher St
- 387 Hartford Ave
- 5 Fales St
- 220 Main St Unit 220
- 18 Mary Anne Dr
- 14 Hawthorne Village Unit D
- 176 Main St Unit 3
- 28 Wellington St
- 21 Riverside Rd
- 15 Broad Acres Farm Rd