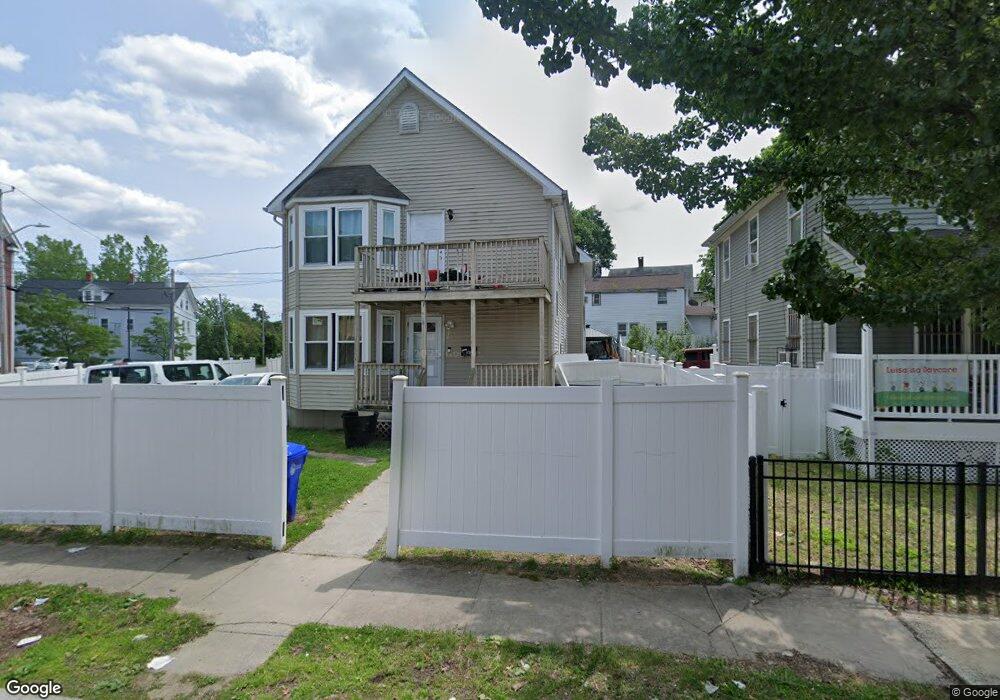
2 Hollis St Providence, RI 02907
West End NeighborhoodEstimated Value: $500,000 - $567,000
4
Beds
2
Baths
2,304
Sq Ft
$232/Sq Ft
Est. Value
About This Home
This home is located at 2 Hollis St, Providence, RI 02907 and is currently estimated at $534,745, approximately $232 per square foot. 2 Hollis St is a home located in Providence County with nearby schools including Asa Messer Elementary School, Charles N. Fortes Elementary School, and Alfred Lima Sr. Elementary School.
Ownership History
Date
Name
Owned For
Owner Type
Purchase Details
Closed on
Nov 23, 2005
Sold by
Karmue Fungbeh D
Bought by
Karmue Richard and Karmue Patience K
Current Estimated Value
Home Financials for this Owner
Home Financials are based on the most recent Mortgage that was taken out on this home.
Original Mortgage
$176,800
Outstanding Balance
$96,990
Interest Rate
6.06%
Mortgage Type
Purchase Money Mortgage
Estimated Equity
$437,755
Purchase Details
Closed on
Feb 2, 2001
Sold by
West Elmwood Housing
Bought by
Karmue Fungbeth D
Home Financials for this Owner
Home Financials are based on the most recent Mortgage that was taken out on this home.
Original Mortgage
$78,900
Interest Rate
7.14%
Mortgage Type
Purchase Money Mortgage
Create a Home Valuation Report for This Property
The Home Valuation Report is an in-depth analysis detailing your home's value as well as a comparison with similar homes in the area
Home Values in the Area
Average Home Value in this Area
Purchase History
| Date | Buyer | Sale Price | Title Company |
|---|---|---|---|
| Karmue Richard | $260,000 | -- | |
| Karmue Fungbeth D | $90,000 | -- |
Source: Public Records
Mortgage History
| Date | Status | Borrower | Loan Amount |
|---|---|---|---|
| Open | Karmue Fungbeth D | $176,800 | |
| Closed | Karmue Fungbeth D | $12,500 | |
| Previous Owner | Karmue Fungbeth D | $78,900 | |
| Closed | Karmue Fungbeth D | $2,500 |
Source: Public Records
Tax History Compared to Growth
Tax History
| Year | Tax Paid | Tax Assessment Tax Assessment Total Assessment is a certain percentage of the fair market value that is determined by local assessors to be the total taxable value of land and additions on the property. | Land | Improvement |
|---|---|---|---|---|
| 2025 | $4,005 | $530,400 | $113,600 | $416,800 |
| 2024 | $6,999 | $381,400 | $75,700 | $305,700 |
| 2023 | $6,999 | $381,400 | $75,700 | $305,700 |
| 2022 | $6,789 | $381,400 | $75,700 | $305,700 |
| 2021 | $5,745 | $233,900 | $38,200 | $195,700 |
| 2020 | $5,745 | $233,900 | $38,200 | $195,700 |
| 2019 | $5,745 | $233,900 | $38,200 | $195,700 |
| 2018 | $5,433 | $170,000 | $37,900 | $132,100 |
| 2017 | $5,433 | $170,000 | $37,900 | $132,100 |
| 2016 | $5,433 | $170,000 | $37,900 | $132,100 |
| 2015 | $4,852 | $146,600 | $37,900 | $108,700 |
| 2014 | $4,948 | $146,600 | $37,900 | $108,700 |
| 2013 | $4,948 | $146,600 | $37,900 | $108,700 |
Source: Public Records
Map
Nearby Homes