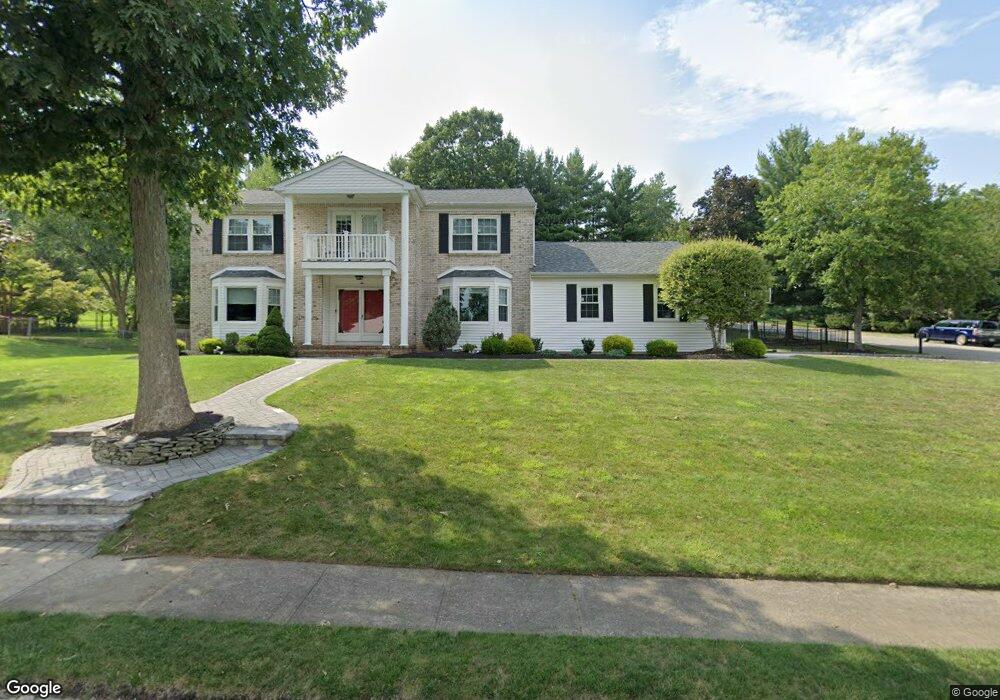
2 Howell Dr West Orange, NJ 07052
Estimated Value: $1,038,000 - $1,094,000
--
Bed
--
Bath
3,302
Sq Ft
$326/Sq Ft
Est. Value
About This Home
This home is located at 2 Howell Dr, West Orange, NJ 07052 and is currently estimated at $1,075,146, approximately $325 per square foot. 2 Howell Dr is a home located in Essex County with nearby schools including West Orange High School, Our Lady of the Lake School, and Trinity Academy.
Ownership History
Date
Name
Owned For
Owner Type
Purchase Details
Closed on
Jul 8, 2011
Sold by
Grossman Suzanne and Grossman Elliot
Bought by
Morrison Mark W and Morrison Valerie T
Current Estimated Value
Home Financials for this Owner
Home Financials are based on the most recent Mortgage that was taken out on this home.
Original Mortgage
$374,200
Outstanding Balance
$257,195
Interest Rate
4.49%
Mortgage Type
New Conventional
Estimated Equity
$817,951
Purchase Details
Closed on
Mar 14, 1997
Sold by
State St Bank
Bought by
Grossman Elliot and Grossman Suzanne
Home Financials for this Owner
Home Financials are based on the most recent Mortgage that was taken out on this home.
Original Mortgage
$323,000
Interest Rate
7.68%
Purchase Details
Closed on
May 15, 1990
Sold by
Ahmad Idrees and Ahmad Patricia
Bought by
Meola Lidia
Create a Home Valuation Report for This Property
The Home Valuation Report is an in-depth analysis detailing your home's value as well as a comparison with similar homes in the area
Home Values in the Area
Average Home Value in this Area
Purchase History
| Date | Buyer | Sale Price | Title Company |
|---|---|---|---|
| Morrison Mark W | $499,000 | None Available | |
| Grossman Elliot | $359,000 | -- | |
| Meola Lidia | $440,000 | -- |
Source: Public Records
Mortgage History
| Date | Status | Borrower | Loan Amount |
|---|---|---|---|
| Open | Morrison Mark W | $374,200 | |
| Previous Owner | Grossman Elliot | $323,000 |
Source: Public Records
Tax History Compared to Growth
Tax History
| Year | Tax Paid | Tax Assessment Tax Assessment Total Assessment is a certain percentage of the fair market value that is determined by local assessors to be the total taxable value of land and additions on the property. | Land | Improvement |
|---|---|---|---|---|
| 2025 | $24,494 | $1,073,000 | $446,400 | $626,600 |
| 2024 | $24,494 | $532,700 | $156,400 | $376,300 |
| 2022 | $23,636 | $532,700 | $156,400 | $376,300 |
| 2021 | $23,194 | $532,700 | $156,400 | $376,300 |
| 2020 | $22,821 | $532,700 | $156,400 | $376,300 |
| 2019 | $22,166 | $532,700 | $156,400 | $376,300 |
| 2018 | $21,510 | $532,700 | $156,400 | $376,300 |
| 2017 | $21,233 | $532,700 | $156,400 | $376,300 |
| 2016 | $20,539 | $528,000 | $156,400 | $371,600 |
| 2015 | $20,154 | $528,000 | $156,400 | $371,600 |
| 2014 | $19,758 | $528,000 | $156,400 | $371,600 |
Source: Public Records
Map
Nearby Homes
- 11 Gerdes Ave
- 31 Rosemont Terrace
- 154 Forest Ave
- 62 Hillside Ave
- 17 Fairway Ave
- 27 Morningside Rd
- 181 Pleasant Valley Way
- 153 Morningside Rd
- 6 Bayowski Rd
- 8 Mullarkey Dr Unit 148
- 33 Knutsen Dr Unit 212
- 19 Currey Ln
- 31 Currey Ln Unit 180
- 3 Davey Dr Unit 23
- 3 Davey Dr
- 82 Fells Rd
- 14 Bongart Dr
- 9 Rappleye Ct
- 2 Kinzel Ln
- 16 W Lincoln St Unit 18