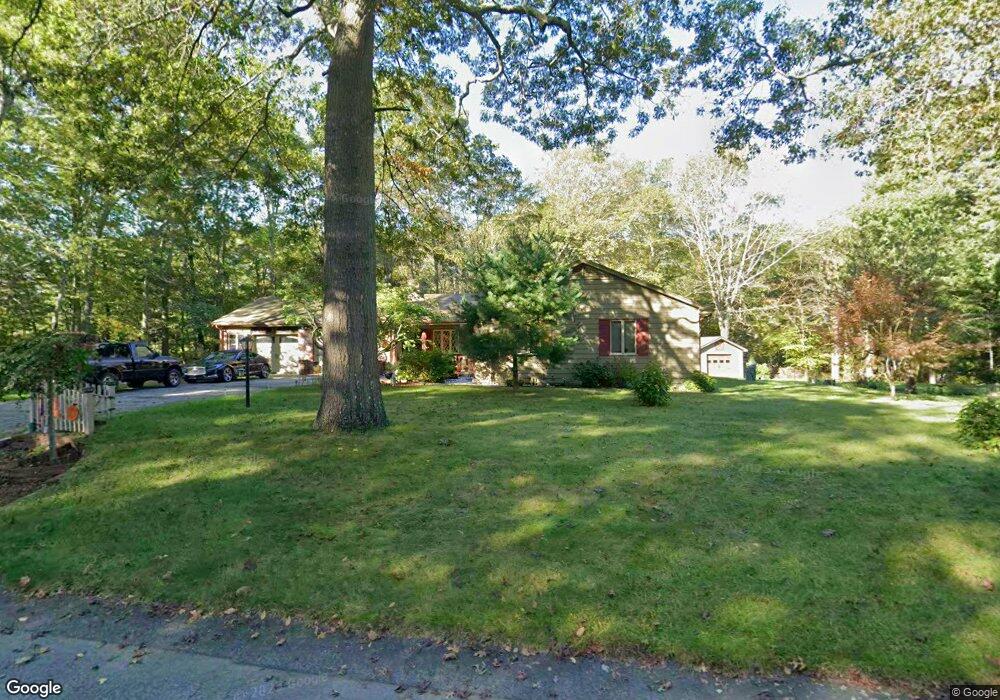
2 Hunt Dr Rehoboth, MA 02769
Estimated Value: $541,446 - $598,000
3
Beds
1
Bath
1,574
Sq Ft
$367/Sq Ft
Est. Value
About This Home
This home is located at 2 Hunt Dr, Rehoboth, MA 02769 and is currently estimated at $577,362, approximately $366 per square foot. 2 Hunt Dr is a home located in Bristol County with nearby schools including Dighton-Rehoboth Regional High School, Cedar Brook School, and The Pinecroft School.
Ownership History
Date
Name
Owned For
Owner Type
Purchase Details
Closed on
Mar 28, 2001
Sold by
Monarch Builders Inc
Bought by
Diruzzo Richard R and Diruzzo Joann M
Current Estimated Value
Home Financials for this Owner
Home Financials are based on the most recent Mortgage that was taken out on this home.
Original Mortgage
$50,000
Outstanding Balance
$18,267
Interest Rate
6.9%
Estimated Equity
$559,095
Create a Home Valuation Report for This Property
The Home Valuation Report is an in-depth analysis detailing your home's value as well as a comparison with similar homes in the area
Home Values in the Area
Average Home Value in this Area
Purchase History
| Date | Buyer | Sale Price | Title Company |
|---|---|---|---|
| Diruzzo Richard R | $227,000 | -- |
Source: Public Records
Mortgage History
| Date | Status | Borrower | Loan Amount |
|---|---|---|---|
| Open | Diruzzo Richard R | $50,000 | |
| Closed | Diruzzo Richard R | $65,000 |
Source: Public Records
Tax History
| Year | Tax Paid | Tax Assessment Tax Assessment Total Assessment is a certain percentage of the fair market value that is determined by local assessors to be the total taxable value of land and additions on the property. | Land | Improvement |
|---|---|---|---|---|
| 2025 | $49 | $439,200 | $207,100 | $232,100 |
| 2024 | $4,986 | $438,900 | $215,800 | $223,100 |
| 2023 | $4,739 | $423,600 | $211,400 | $212,200 |
| 2022 | $4,739 | $374,000 | $194,500 | $179,500 |
| 2021 | $4,525 | $341,800 | $177,900 | $163,900 |
| 2020 | $4,387 | $334,400 | $181,100 | $153,300 |
| 2018 | $3,961 | $330,900 | $177,400 | $153,500 |
| 2017 | $3,847 | $306,300 | $185,000 | $121,300 |
| 2016 | $3,822 | $314,600 | $192,700 | $121,900 |
| 2015 | $3,623 | $294,300 | $184,100 | $110,200 |
| 2014 | $3,553 | $285,600 | $175,400 | $110,200 |
Source: Public Records
Map
Nearby Homes
Your Personal Tour Guide
Ask me questions while you tour the home.