Estimated Value: $1,313,151 - $1,455,000
4
Beds
4
Baths
3,900
Sq Ft
$356/Sq Ft
Est. Value
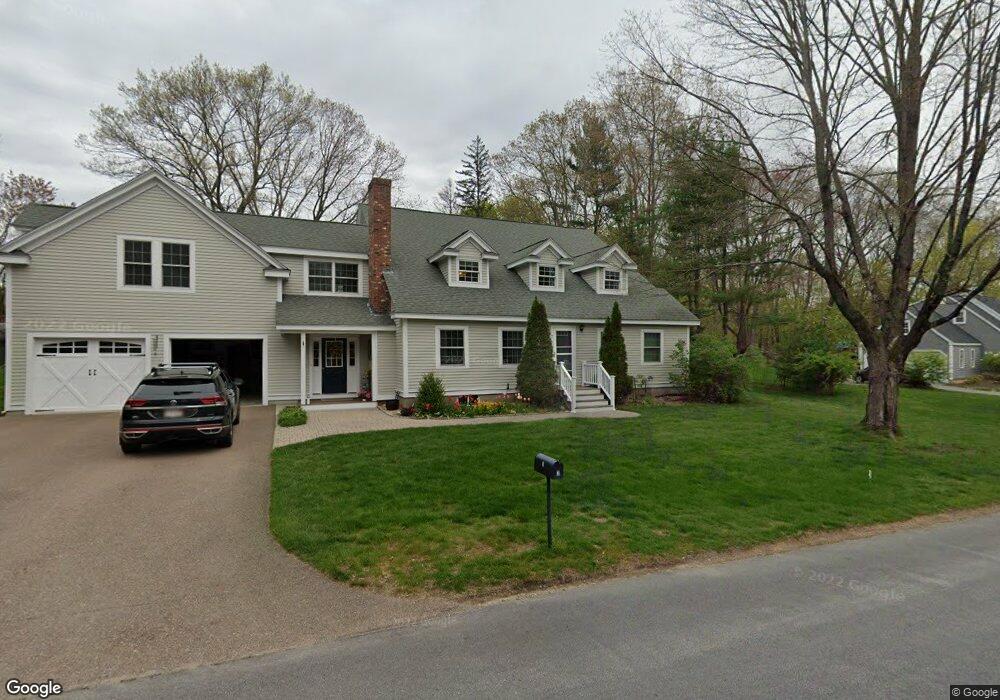
About This Home
This home is located at 2 Huron Rd, Acton, MA 01720 and is currently estimated at $1,387,038, approximately $355 per square foot. 2 Huron Rd is a home located in Middlesex County with nearby schools including Acton-Boxborough Regional High School and Oak Meadow Montessori School.
Ownership History
Date
Name
Owned For
Owner Type
Purchase Details
Closed on
May 1, 2009
Sold by
Fields Richard A
Bought by
Oriley Sean B and Oriley Gayle C
Current Estimated Value
Home Financials for this Owner
Home Financials are based on the most recent Mortgage that was taken out on this home.
Original Mortgage
$465,000
Outstanding Balance
$293,956
Interest Rate
4.86%
Mortgage Type
Purchase Money Mortgage
Estimated Equity
$1,093,082
Create a Home Valuation Report for This Property
The Home Valuation Report is an in-depth analysis detailing your home's value as well as a comparison with similar homes in the area
Home Values in the Area
Average Home Value in this Area
Purchase History
| Date | Buyer | Sale Price | Title Company |
|---|---|---|---|
| Oriley Sean B | $780,000 | -- |
Source: Public Records
Mortgage History
| Date | Status | Borrower | Loan Amount |
|---|---|---|---|
| Open | Oriley Sean B | $465,000 |
Source: Public Records
Tax History
| Year | Tax Paid | Tax Assessment Tax Assessment Total Assessment is a certain percentage of the fair market value that is determined by local assessors to be the total taxable value of land and additions on the property. | Land | Improvement |
|---|---|---|---|---|
| 2025 | $21,808 | $1,271,600 | $317,500 | $954,100 |
| 2024 | $20,389 | $1,223,100 | $317,500 | $905,600 |
| 2023 | $20,968 | $1,194,100 | $288,500 | $905,600 |
| 2022 | $18,534 | $952,900 | $250,800 | $702,100 |
| 2021 | $18,211 | $900,200 | $232,100 | $668,100 |
| 2020 | $16,695 | $867,700 | $232,100 | $635,600 |
| 2019 | $16,321 | $842,600 | $232,100 | $610,500 |
| 2018 | $15,923 | $821,600 | $232,100 | $589,500 |
| 2017 | $15,660 | $821,600 | $232,100 | $589,500 |
| 2016 | $14,492 | $753,600 | $232,100 | $521,500 |
| 2015 | $14,358 | $753,700 | $232,100 | $521,600 |
| 2014 | $13,743 | $706,600 | $232,100 | $474,500 |
Source: Public Records
Map
Nearby Homes
- 60 Nashoba Rd
- 4 Littlefield Rd
- 5 Perkins Ln
- 79 Charter Rd
- 20 Joseph Reed Ln
- 4 Omega Way
- 235 Arlington St
- 285 Central St Unit 285
- 18 Hayward Rd
- 11 Braebrook
- 246 Main St Unit 2
- 33 Meadowbrook Rd
- 305 Harwood Ave
- 7 Kelley Rd
- 92 Willow St Unit 3
- 92 Willow St Unit 2
- 90 Willow St Unit 1
- 46 Taylor Rd
- 491 Main St
- 524 Main St
Your Personal Tour Guide
Ask me questions while you tour the home.