2 Increase Ward Dr Northborough, MA 01532
Estimated Value: $916,002 - $1,004,000
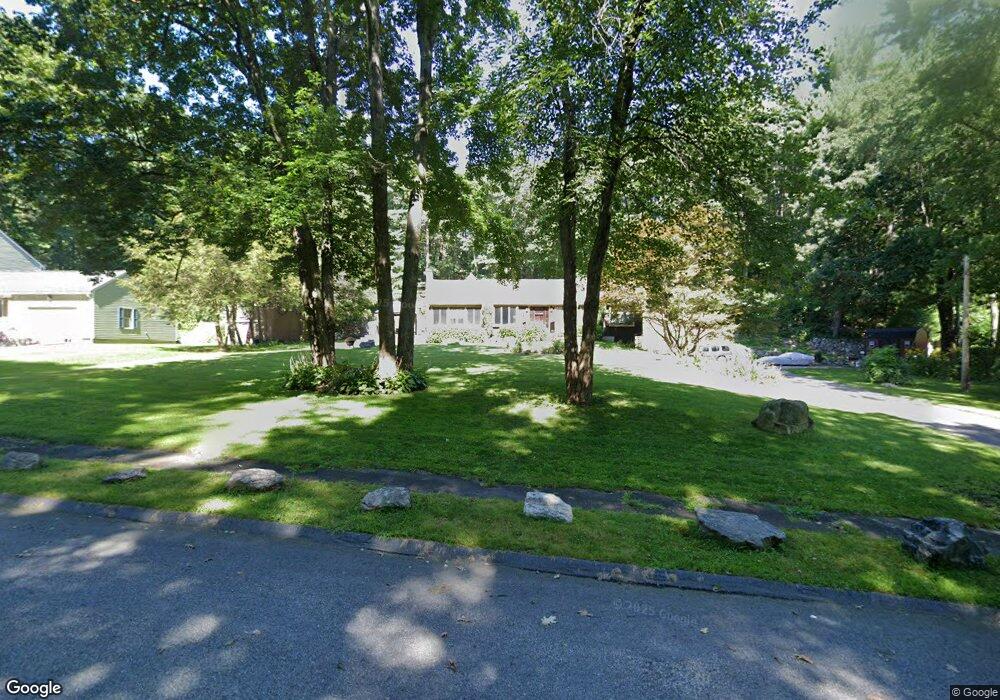
About This Home
This home is located at 2 Increase Ward Dr, Northborough, MA 01532 and is currently estimated at $960,501, approximately $340 per square foot. 2 Increase Ward Dr is a home located in Worcester County with nearby schools including Lincoln Street Elementary School, Robert E. Melican Middle School, and Algonquin Regional High School.
Ownership History
We collect this data history from publicly available records. To have your information removed, we recommend requesting removal directly through your county’s website.
Purchase Details
Purchase Details
Home Values in the Area
Average Home Value in this Area
Purchase History
We collect this data history from publicly available records. To have your information removed, we recommend requesting removal directly through your county’s website.
| Date | Buyer | Sale Price | Title Company |
|---|---|---|---|
| $265,000 | -- | ||
| $50,000 | -- |
Mortgage History
We collect this data history from publicly available records. To have your information removed, we recommend requesting removal directly through your county’s website.
| Date | Status | Borrower | Loan Amount |
|---|---|---|---|
| Open | $360,000 | ||
| Closed | $100,000 | ||
| Closed | $307,500 |
Tax History
We collect this data history from publicly available records. To have your information removed, we recommend requesting removal directly through your county’s website.
| Year | Tax Paid | Tax Assessment Tax Assessment Total Assessment is a certain percentage of the fair market value that is determined by local assessors to be the total taxable value of land and additions on the property. | Land | Improvement |
|---|---|---|---|---|
| 2025 | $12,051 | $845,700 | $279,400 | $566,300 |
| 2024 | $11,128 | $779,300 | $231,100 | $548,200 |
| 2023 | $10,948 | $740,200 | $218,300 | $521,900 |
| 2022 | $10,310 | $625,200 | $207,900 | $417,300 |
| 2021 | $9,959 | $581,700 | $189,100 | $392,600 |
| 2020 | $10,224 | $592,700 | $189,100 | $403,600 |
| 2019 | $9,789 | $570,800 | $183,500 | $387,300 |
| 2018 | $9,241 | $531,400 | $173,100 | $358,300 |
| 2017 | $8,608 | $495,000 | $173,100 | $321,900 |
| 2016 | $8,180 | $476,400 | $169,700 | $306,700 |
| 2015 | $7,773 | $464,600 | $172,500 | $292,100 |
| 2014 | $7,361 | $443,700 | $172,500 | $271,200 |
Map
- 72 Oak Ave
- 44 Lincoln St
- 29 Lydias Way
- 8 Lydia's Way Unit 8
- 9 Cyrus Way
- 14 Lydias Way Unit 14
- 130 Pleasant St
- 192 W Main St Unit 192
- 91 Pleasant St
- 329 Crawford St
- 2 Birch Hill Rd
- 1 Ignatius Common Dr
- 27 Westbrook Rd
- 26 Dennis Cir
- 39 Pleasant St Unit A6
- 39 Pleasant St Unit B21
- 10 Cold Harbor Dr
- 19 Jefferson Rd
- 137 South St
- 18 Mayflower Rd
Ask me questions while you tour the home.