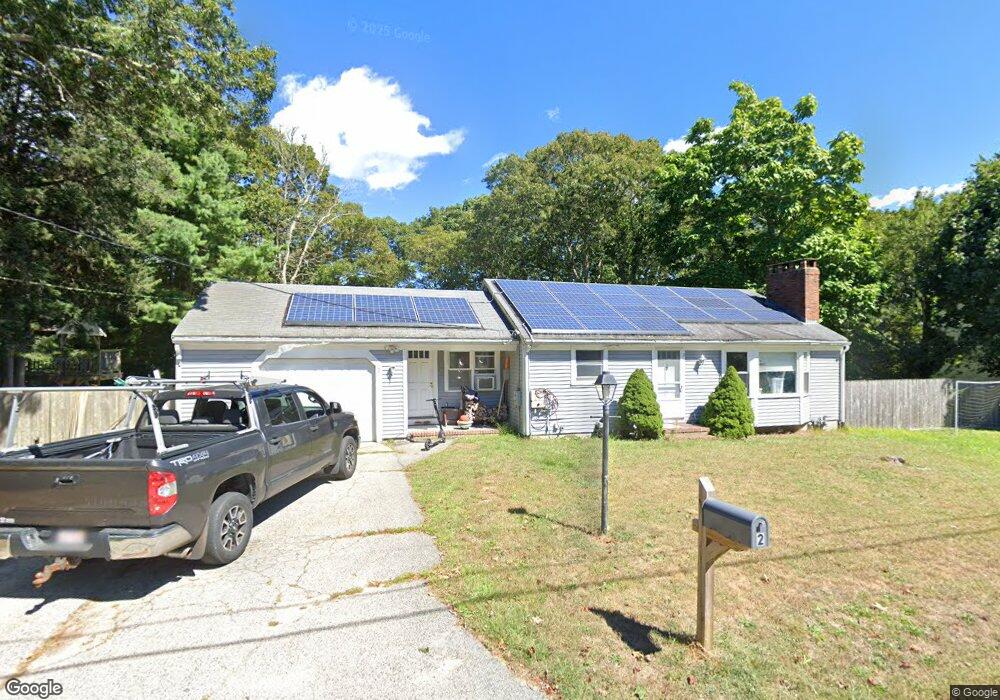
2 Iris Rd West Yarmouth, MA 02673
West Yarmouth NeighborhoodEstimated Value: $488,000 - $519,000
2
Beds
1
Bath
1,104
Sq Ft
$456/Sq Ft
Est. Value
About This Home
This home is located at 2 Iris Rd, West Yarmouth, MA 02673 and is currently estimated at $503,149, approximately $455 per square foot. 2 Iris Rd is a home located in Barnstable County with nearby schools including Dennis-Yarmouth Regional High School, Barnstable Community Horace Mann Charter Public School, and Sturgis Charter Public School.
Ownership History
Date
Name
Owned For
Owner Type
Purchase Details
Closed on
Dec 20, 2004
Sold by
Collin-Yaffe Meryl B
Bought by
Dean James J
Current Estimated Value
Home Financials for this Owner
Home Financials are based on the most recent Mortgage that was taken out on this home.
Original Mortgage
$240,937
Outstanding Balance
$120,260
Interest Rate
5.68%
Mortgage Type
Purchase Money Mortgage
Estimated Equity
$382,889
Purchase Details
Closed on
Aug 25, 2004
Sold by
Int Collin Yaffe
Bought by
Collin-Yaffe Meryl B
Home Financials for this Owner
Home Financials are based on the most recent Mortgage that was taken out on this home.
Original Mortgage
$228,000
Interest Rate
6.02%
Purchase Details
Closed on
Oct 10, 1989
Sold by
Smith Robert E
Bought by
Yaffe Meryl B
Create a Home Valuation Report for This Property
The Home Valuation Report is an in-depth analysis detailing your home's value as well as a comparison with similar homes in the area
Home Values in the Area
Average Home Value in this Area
Purchase History
| Date | Buyer | Sale Price | Title Company |
|---|---|---|---|
| Dean James J | $257,000 | -- | |
| Collin-Yaffe Meryl B | -- | -- | |
| Yaffe Meryl B | $115,000 | -- |
Source: Public Records
Mortgage History
| Date | Status | Borrower | Loan Amount |
|---|---|---|---|
| Open | Dean James J | $240,937 | |
| Closed | Dean James J | $38,550 | |
| Previous Owner | Collin-Yaffe Meryl B | $228,000 | |
| Previous Owner | Yaffe Meryl B | $200,000 | |
| Previous Owner | Yaffe Meryl B | $85,000 |
Source: Public Records
Tax History Compared to Growth
Tax History
| Year | Tax Paid | Tax Assessment Tax Assessment Total Assessment is a certain percentage of the fair market value that is determined by local assessors to be the total taxable value of land and additions on the property. | Land | Improvement |
|---|---|---|---|---|
| 2025 | $3,076 | $434,500 | $141,400 | $293,100 |
| 2024 | $3,085 | $418,000 | $149,000 | $269,000 |
| 2023 | $3,008 | $370,900 | $132,800 | $238,100 |
| 2022 | $2,831 | $308,400 | $119,500 | $188,900 |
| 2021 | $2,668 | $279,100 | $119,500 | $159,600 |
| 2020 | $2,615 | $261,500 | $119,500 | $142,000 |
| 2019 | $3,829 | $240,500 | $119,500 | $121,000 |
| 2018 | $2,247 | $218,400 | $97,400 | $121,000 |
| 2017 | $2,188 | $218,400 | $97,400 | $121,000 |
| 2016 | $2,091 | $209,500 | $88,500 | $121,000 |
| 2015 | $1,989 | $198,100 | $88,500 | $109,600 |
Source: Public Records
Map
Nearby Homes
- 481 Buck Island Rd Unit 9AA
- 481 Buck Island Rd Unit 17FA
- 0 Ken's Way
- 441 Buck Island Rd Unit G3
- 441 Buck Island Rd Unit G3
- 441 Buck Island Rd Unit E5
- 441 Buck Island Rd Unit B1
- 441 Buck Island Rd Unit E1
- 23 Baxter Ave
- 10 Standish Way
- 12 Denver Dr
- 38 Traders Ln
- 38 Traders Ln
- 13 Webster Rd
- 121 Camp St Unit 128
- 9 Roberta Dr
- 32 Wimbledon Dr
- 16 Iyannough Rd
- 248 Camp St Unit M5
- 300 Buck Island Rd Unit 8B
- 1 Iris Rd
- 8 Iris Rd
- 35 Rosemary Ln
- 30 Marigold Rd
- 27 Rosemary Ln
- 32 Woodbine Ave
- 14 Iris Rd Unit 16
- 14 Iris Rd Unit 14,16
- 14-16 Iris Rd
- 36 Town Brook Rd
- 36 Rosemary Ln
- 29 Marigold Rd
- 30 Woodbine Ave
- 26 Marigold Rd
- 30 Rosemary Ln
- 28 Woodbine Ave
- 31 Woodbine Ave
- 23 Marigold Rd
- 26 Rosemary Ln
- 21 Rosemary Ln