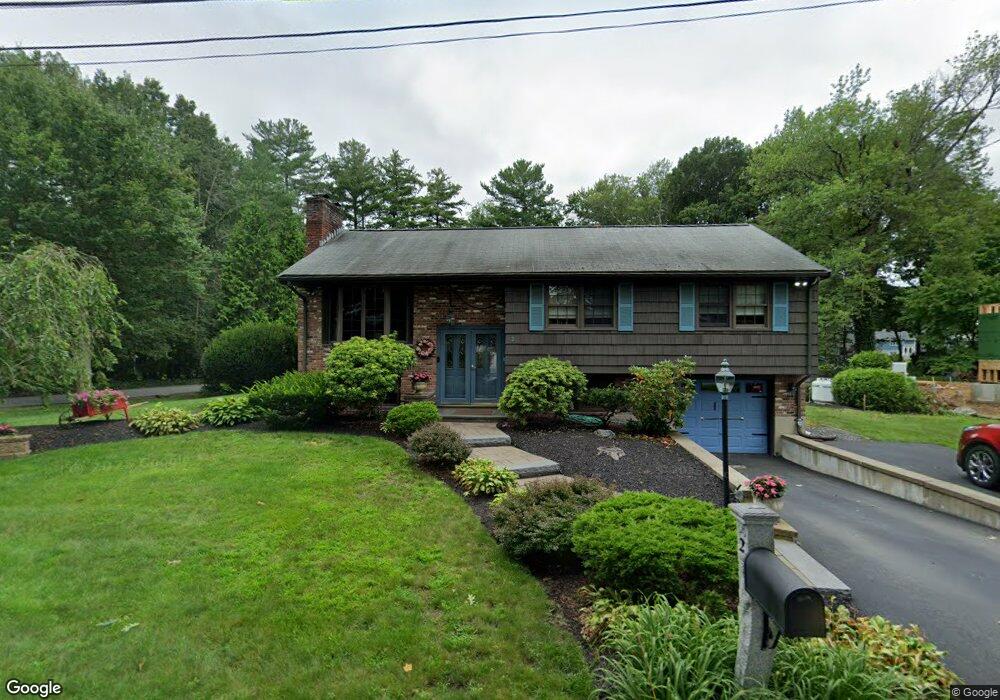
2 Ivy Ln Unit A Burlington, MA 01803
North Burlington NeighborhoodEstimated Value: $1,040,000 - $1,402,000
3
Beds
3
Baths
3,409
Sq Ft
$356/Sq Ft
Est. Value
About This Home
This home is located at 2 Ivy Ln Unit A, Burlington, MA 01803 and is currently estimated at $1,211,988, approximately $355 per square foot. 2 Ivy Ln Unit A is a home located in Middlesex County with nearby schools including Burlington High School, Marshall Simonds Middle School, and Mount Hope Christian School.
Ownership History
Date
Name
Owned For
Owner Type
Purchase Details
Closed on
Aug 13, 2012
Sold by
Pasciuto Michael A and Pasciuto Kimberly C
Bought by
Pasciuto Kimberly C
Current Estimated Value
Purchase Details
Closed on
Mar 5, 2008
Sold by
Map Kcp Rt and Pasciuto
Bought by
Pasciuto Kimberly C and Pasciuto Michael A
Purchase Details
Closed on
Dec 17, 2004
Sold by
Pasciuto Kimberly C and Pasciuto Michael A
Bought by
Map-Kcp Rt and Pasciuto
Purchase Details
Closed on
Jan 20, 1995
Sold by
Maciver Dana C and Maciver Cheryl A
Bought by
Pasciuto Michael A and Pasciuto Kimberly C
Home Financials for this Owner
Home Financials are based on the most recent Mortgage that was taken out on this home.
Original Mortgage
$180,000
Interest Rate
9.16%
Mortgage Type
Purchase Money Mortgage
Create a Home Valuation Report for This Property
The Home Valuation Report is an in-depth analysis detailing your home's value as well as a comparison with similar homes in the area
Home Values in the Area
Average Home Value in this Area
Purchase History
| Date | Buyer | Sale Price | Title Company |
|---|---|---|---|
| Pasciuto Kimberly C | -- | -- | |
| Pasciuto Kimberly C | -- | -- | |
| Pasciuto Kimberly C | -- | -- | |
| Map-Kcp Rt | -- | -- | |
| Pasciuto Michael A | $225,000 | -- | |
| Pasciuto Michael A | $225,000 | -- |
Source: Public Records
Mortgage History
| Date | Status | Borrower | Loan Amount |
|---|---|---|---|
| Previous Owner | Pasciuto Michael A | $180,000 |
Source: Public Records
Tax History Compared to Growth
Tax History
| Year | Tax Paid | Tax Assessment Tax Assessment Total Assessment is a certain percentage of the fair market value that is determined by local assessors to be the total taxable value of land and additions on the property. | Land | Improvement |
|---|---|---|---|---|
| 2025 | $8,118 | $937,400 | $426,400 | $511,000 |
| 2024 | $7,898 | $883,500 | $404,300 | $479,200 |
| 2023 | $7,710 | $820,200 | $351,300 | $468,900 |
| 2022 | $7,548 | $758,600 | $320,300 | $438,300 |
| 2021 | $7,260 | $729,600 | $291,300 | $438,300 |
| 2020 | $7,043 | $730,600 | $291,300 | $439,300 |
| 2019 | $7,016 | $669,500 | $272,300 | $397,200 |
| 2018 | $6,409 | $603,500 | $259,300 | $344,200 |
| 2017 | $6,376 | $603,500 | $259,300 | $344,200 |
| 2016 | $6,339 | $553,100 | $221,300 | $331,800 |
Source: Public Records
Map
Nearby Homes