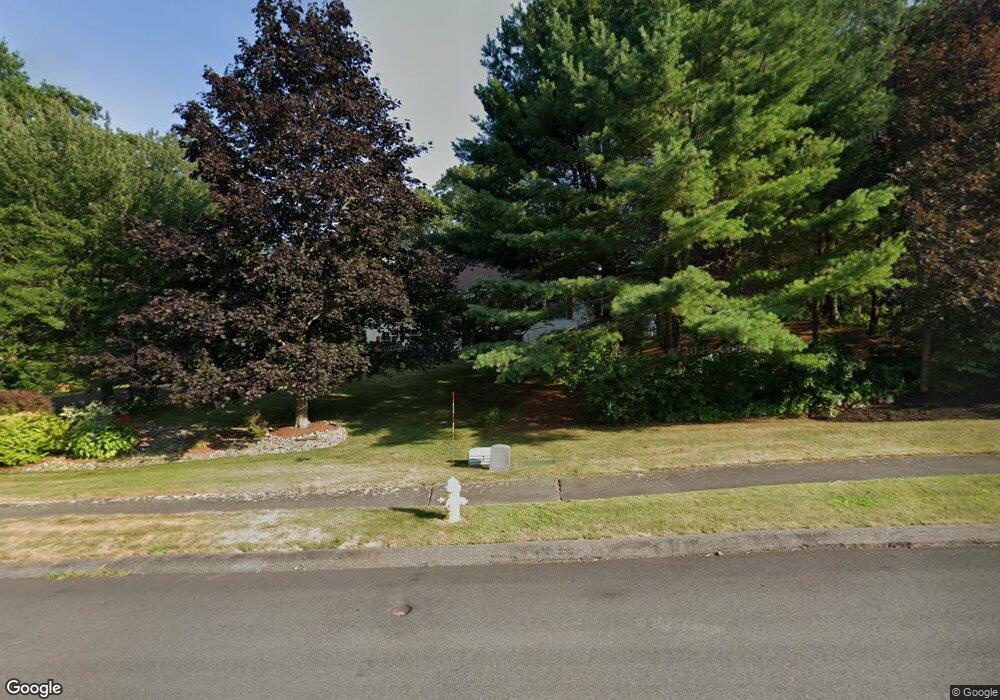
2 James Ave Middleton, MA 01949
Estimated Value: $848,544 - $940,000
3
Beds
3
Baths
1,568
Sq Ft
$571/Sq Ft
Est. Value
About This Home
This home is located at 2 James Ave, Middleton, MA 01949 and is currently estimated at $894,886, approximately $570 per square foot. 2 James Ave is a home located in Essex County with nearby schools including Howe-Manning Elementary School, Fuller Meadow Elementary School, and Masconomet Regional Middle School.
Ownership History
Date
Name
Owned For
Owner Type
Purchase Details
Closed on
Mar 7, 2019
Sold by
Lemmo Rosalie and Lemmo Victor A
Bought by
2 James Avenue Ret
Current Estimated Value
Purchase Details
Closed on
Nov 9, 1993
Sold by
Fieldstone Place Corp
Bought by
Lemmo Victor A and Lemmo Rosalie
Create a Home Valuation Report for This Property
The Home Valuation Report is an in-depth analysis detailing your home's value as well as a comparison with similar homes in the area
Home Values in the Area
Average Home Value in this Area
Purchase History
| Date | Buyer | Sale Price | Title Company |
|---|---|---|---|
| 2 James Avenue Ret | -- | -- | |
| 2 James Avenue Ret | -- | -- | |
| 2 James Avenue Ret | -- | -- | |
| Lemmo Victor A | $85,000 | -- | |
| Lemmo Victor A | $85,000 | -- |
Source: Public Records
Tax History Compared to Growth
Tax History
| Year | Tax Paid | Tax Assessment Tax Assessment Total Assessment is a certain percentage of the fair market value that is determined by local assessors to be the total taxable value of land and additions on the property. | Land | Improvement |
|---|---|---|---|---|
| 2025 | $9,989 | $840,100 | $410,200 | $429,900 |
| 2024 | $8,604 | $729,800 | $383,600 | $346,200 |
| 2023 | $9,400 | $730,400 | $419,700 | $310,700 |
| 2022 | $8,089 | $610,500 | $332,000 | $278,500 |
| 2021 | $8,218 | $599,000 | $314,900 | $284,100 |
| 2020 | $8,338 | $612,200 | $324,400 | $287,800 |
| 2019 | $8,206 | $599,400 | $309,200 | $290,200 |
| 2018 | $7,481 | $535,900 | $303,500 | $232,400 |
| 2017 | $7,371 | $528,400 | $259,800 | $268,600 |
| 2016 | $7,187 | $517,400 | $244,600 | $272,800 |
| 2015 | $6,803 | $493,700 | $240,800 | $252,900 |
Source: Public Records
Map
Nearby Homes
- 2 Tyler Ln
- 6 White Ln
- 62 Cabral Dr
- 15 Couture Way
- 1 Mills Point Unit 1
- 119 River St
- 28 Niblick Way
- 44 Brassie Way
- 8 Brookside Rd
- 53 N Main St Unit 53
- 49 Maple St Unit B
- 39 Central St
- 103 Elm St
- 37 Peaslee Cir Unit 37
- 5 Theresa Rd
- 10 Dogwood Ln
- 89 Forest St
- 10 Callaway Dr Unit 10
- 220 Swan Pond Rd
- 1466 Main St