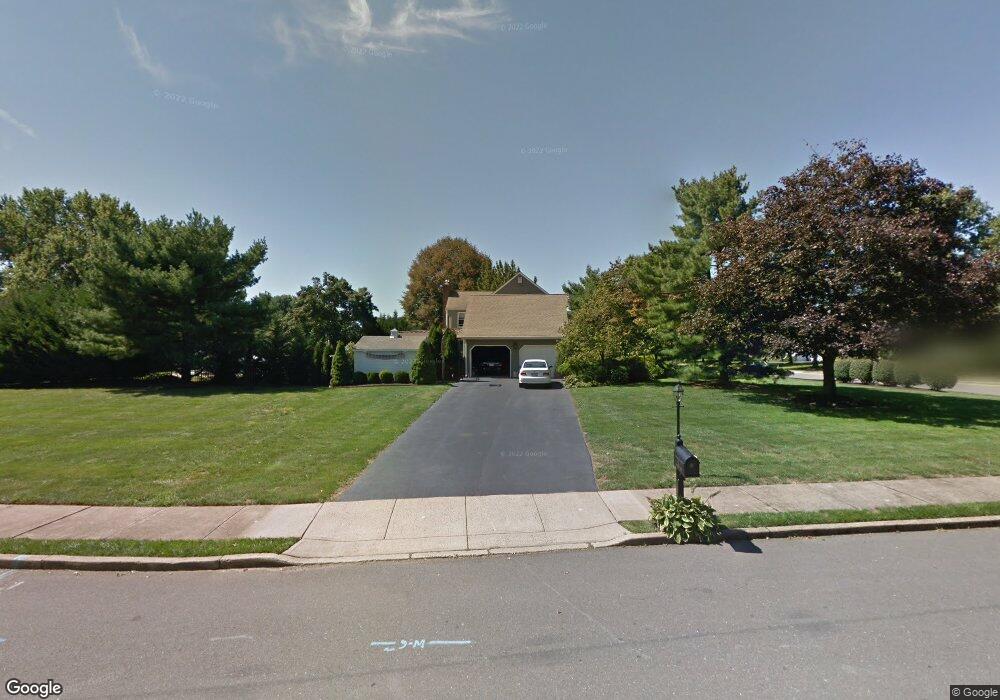
2 Jefferson Rd Cranbury, NJ 08512
Estimated Value: $969,283 - $1,201,000
Studio
--
Bath
2,722
Sq Ft
$398/Sq Ft
Est. Value
About This Home
This home is located at 2 Jefferson Rd, Cranbury, NJ 08512 and is currently estimated at $1,083,821, approximately $398 per square foot. 2 Jefferson Rd is a home located in Middlesex County with nearby schools including The Cranbury School, E Windsor Knowledge Beginnings, and SciCore Academy.
Ownership History
Date
Name
Owned For
Owner Type
Purchase Details
Closed on
May 5, 1998
Sold by
Meyer Frank
Bought by
Beach James and Beach Lisa
Current Estimated Value
Home Financials for this Owner
Home Financials are based on the most recent Mortgage that was taken out on this home.
Original Mortgage
$281,200
Interest Rate
6.9%
Purchase Details
Closed on
May 29, 1996
Sold by
Stenson John
Bought by
Meyer Frank and Meyer Janice
Home Financials for this Owner
Home Financials are based on the most recent Mortgage that was taken out on this home.
Original Mortgage
$266,000
Interest Rate
7.89%
Create a Home Valuation Report for This Property
The Home Valuation Report is an in-depth analysis detailing your home's value as well as a comparison with similar homes in the area
Home Values in the Area
Average Home Value in this Area
Purchase History
| Date | Buyer | Sale Price | Title Company |
|---|---|---|---|
| Beach James | $351,500 | -- | |
| Meyer Frank | $332,500 | -- |
Source: Public Records
Mortgage History
| Date | Status | Borrower | Loan Amount |
|---|---|---|---|
| Previous Owner | Beach James | $281,200 | |
| Previous Owner | Meyer Frank | $266,000 |
Source: Public Records
Tax History
| Year | Tax Paid | Tax Assessment Tax Assessment Total Assessment is a certain percentage of the fair market value that is determined by local assessors to be the total taxable value of land and additions on the property. | Land | Improvement |
|---|---|---|---|---|
| 2025 | $12,783 | $697,000 | $280,700 | $416,300 |
| 2024 | $12,602 | $697,000 | $280,700 | $416,300 |
| 2023 | $12,602 | $697,000 | $280,700 | $416,300 |
| 2022 | $12,421 | $697,000 | $280,700 | $416,300 |
| 2021 | $9,336 | $697,000 | $280,700 | $416,300 |
| 2020 | $12,407 | $697,000 | $280,700 | $416,300 |
| 2019 | $12,539 | $697,000 | $280,700 | $416,300 |
| 2018 | $13,724 | $697,000 | $280,700 | $416,300 |
| 2017 | $13,361 | $697,000 | $280,700 | $416,300 |
| 2016 | $13,473 | $697,000 | $280,700 | $416,300 |
| 2015 | $13,229 | $697,000 | $280,700 | $416,300 |
| 2014 | $13,278 | $697,000 | $280,700 | $416,300 |
Source: Public Records
Map
Nearby Homes
- 80 Einstein Way
- 5 Mary Ct
- 5 Trowbridge Ln
- 10 Liedtke Dr
- 7 Liedtke Dr
- 9 Liedtke Dr
- 41 Haymarket Ct
- 1814 Old Stone Mill Dr
- 88 Aristotle Way
- 2312 Old Stone Mill Dr
- 110 S Main St
- 3 Arthur Ln
- 4 Arthur Ln
- 5 Arthur Ln
- 7 Arthur Ln
- 9 Williamson Ct
- 4 South Dr
- 17 South Dr
- 116 G the Orchards
- 132 The Orchard Unit L
Your Personal Tour Guide
Ask me questions while you tour the home.