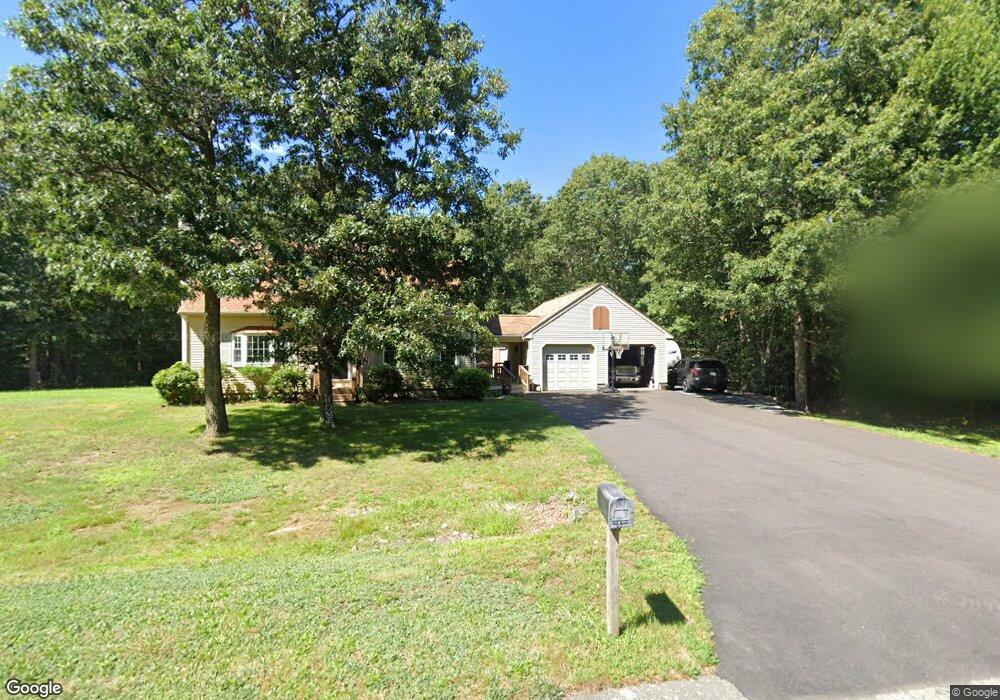
2 Jillian Way Westport, MA 02790
Brownell/Giffords Corner NeighborhoodEstimated Value: $593,000 - $710,000
3
Beds
--
Bath
1,834
Sq Ft
$356/Sq Ft
Est. Value
About This Home
This home is located at 2 Jillian Way, Westport, MA 02790 and is currently estimated at $652,139, approximately $355 per square foot. 2 Jillian Way is a home located in Bristol County with nearby schools including Alice A. Macomber Primary School, Westport Elementary School, and Westport Middle-High School.
Ownership History
Date
Name
Owned For
Owner Type
Purchase Details
Closed on
Aug 31, 2004
Sold by
Melanson Kevin J and Melanson Pamela A
Bought by
Melanson Kevin J
Current Estimated Value
Purchase Details
Closed on
Nov 26, 1997
Sold by
Long Realty Inc
Bought by
Melanson Kevin J and Melanson Pamela A
Home Financials for this Owner
Home Financials are based on the most recent Mortgage that was taken out on this home.
Original Mortgage
$126,000
Interest Rate
7.26%
Mortgage Type
Purchase Money Mortgage
Create a Home Valuation Report for This Property
The Home Valuation Report is an in-depth analysis detailing your home's value as well as a comparison with similar homes in the area
Home Values in the Area
Average Home Value in this Area
Purchase History
| Date | Buyer | Sale Price | Title Company |
|---|---|---|---|
| Melanson Kevin J | -- | -- | |
| Melanson Kevin J | $158,320 | -- |
Source: Public Records
Mortgage History
| Date | Status | Borrower | Loan Amount |
|---|---|---|---|
| Open | Melanson Kevin J | $105,000 | |
| Previous Owner | Melanson Kevin J | $118,000 | |
| Previous Owner | Melanson Kevin J | $126,000 |
Source: Public Records
Tax History Compared to Growth
Tax History
| Year | Tax Paid | Tax Assessment Tax Assessment Total Assessment is a certain percentage of the fair market value that is determined by local assessors to be the total taxable value of land and additions on the property. | Land | Improvement |
|---|---|---|---|---|
| 2025 | $3,817 | $512,400 | $195,100 | $317,300 |
| 2024 | $3,799 | $491,400 | $180,800 | $310,600 |
| 2023 | $3,751 | $459,700 | $158,400 | $301,300 |
| 2022 | $3,447 | $414,300 | $158,400 | $255,900 |
| 2021 | $3,447 | $399,900 | $144,000 | $255,900 |
| 2020 | $3,323 | $394,200 | $138,300 | $255,900 |
| 2019 | $3,059 | $369,900 | $126,300 | $243,600 |
| 2018 | $2,839 | $347,500 | $125,300 | $222,200 |
| 2017 | $2,811 | $352,700 | $125,300 | $227,400 |
| 2016 | $2,715 | $343,200 | $125,300 | $217,900 |
| 2015 | $2,590 | $326,600 | $125,300 | $201,300 |
Source: Public Records
Map
Nearby Homes
- 6 Angel Ct
- 218 American Legion Hwy
- 118 Charlotte White Rd
- 978 Sodom Rd
- 308 Robert St
- 47 Robert St
- 40 Robert St
- 33 Moniz Dr
- 47 Devol Ave
- 8 Strawberry Ln
- 4 Main Rd
- 771 Sanford Rd
- 374 Crandall Rd
- 51 Newton St
- Lot 0 Marcotte
- 118 Charlotte White Rd Extension
- 0 Hidden Glen Ln
- 8 Campion Ave
- 0 Crandall Rd
- 0 Tickle Rd Unit 73453134