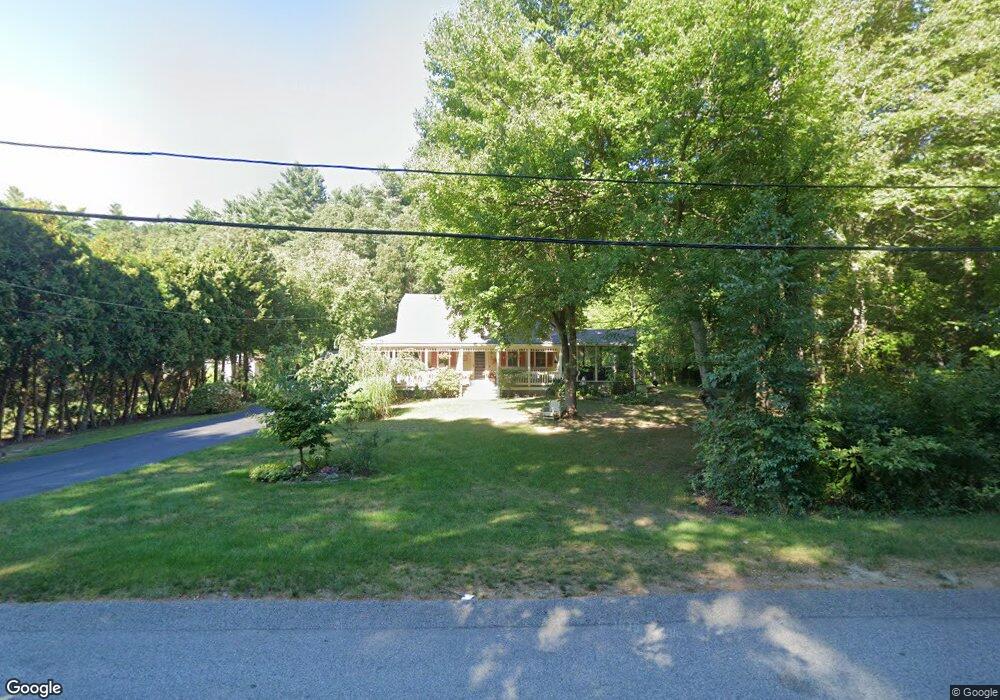
2 Joaquin Ave Assonet, MA 02702
Estimated Value: $486,000 - $625,000
Studio
2
Baths
1,700
Sq Ft
$331/Sq Ft
Est. Value
About This Home
This home is located at 2 Joaquin Ave, Assonet, MA 02702 and is currently estimated at $561,857, approximately $330 per square foot. 2 Joaquin Ave is a home located in Bristol County with nearby schools including Freetown Elementary School, George R Austin Intermediate School, and Freetown-Lakeville Middle School.
Ownership History
Date
Name
Owned For
Owner Type
Purchase Details
Closed on
Feb 16, 2024
Sold by
Garell Stephen K and Garell Jacquelie A
Bought by
Garell Stephen K and Garell Jacqueline A
Current Estimated Value
Purchase Details
Closed on
May 26, 1978
Bought by
Garell Stephen K and Garell Jacqueline
Create a Home Valuation Report for This Property
The Home Valuation Report is an in-depth analysis detailing your home's value as well as a comparison with similar homes in the area
Purchase History
| Date | Buyer | Sale Price | Title Company |
|---|---|---|---|
| Garell Stephen K | -- | None Available | |
| Garell Stephen K | $7,500 | -- |
Source: Public Records
Mortgage History
| Date | Status | Borrower | Loan Amount |
|---|---|---|---|
| Previous Owner | Garell Stephen K | $168,000 | |
| Previous Owner | Garell Stephen K | $124,950 | |
| Previous Owner | Garell Stephen K | $43,800 |
Source: Public Records
Tax History
| Year | Tax Paid | Tax Assessment Tax Assessment Total Assessment is a certain percentage of the fair market value that is determined by local assessors to be the total taxable value of land and additions on the property. | Land | Improvement |
|---|---|---|---|---|
| 2025 | $4,613 | $465,500 | $176,500 | $289,000 |
| 2024 | $4,620 | $443,000 | $166,500 | $276,500 |
| 2023 | $4,482 | $418,500 | $150,000 | $268,500 |
| 2022 | $4,272 | $354,200 | $127,100 | $227,100 |
| 2021 | $4,129 | $325,100 | $115,500 | $209,600 |
| 2020 | $4,071 | $312,700 | $111,100 | $201,600 |
| 2019 | $3,845 | $292,400 | $105,800 | $186,600 |
| 2018 | $3,662 | $275,100 | $105,800 | $169,300 |
| 2017 | $3,558 | $267,100 | $105,800 | $161,300 |
| 2016 | $3,070 | $234,500 | $102,800 | $131,700 |
| 2015 | $3,017 | $233,900 | $102,800 | $131,100 |
| 2014 | $2,914 | $231,100 | $100,600 | $130,500 |
Source: Public Records
Map
Nearby Homes
- 24 Bells Brook Rd
- 71 County St
- 145 County St
- 52 Anthony St
- 0 Sammys Ln
- 37 Simpson Ln
- 14 Marks Ln
- 5 Hadley Heights Way
- 16 Water St Unit C
- 16 Water St Unit A
- 16 Water St Unit B
- 16 Water St Unit D
- 23 Elmwood Dr
- 4 Hadley Heights Way
- 144 Chace Rd
- 42 High St
- 92 Chace Rd
- 00 Island Rd
- 73 Seymour St
- 14 Spruce Rd
Your Personal Tour Guide
Ask me questions while you tour the home.