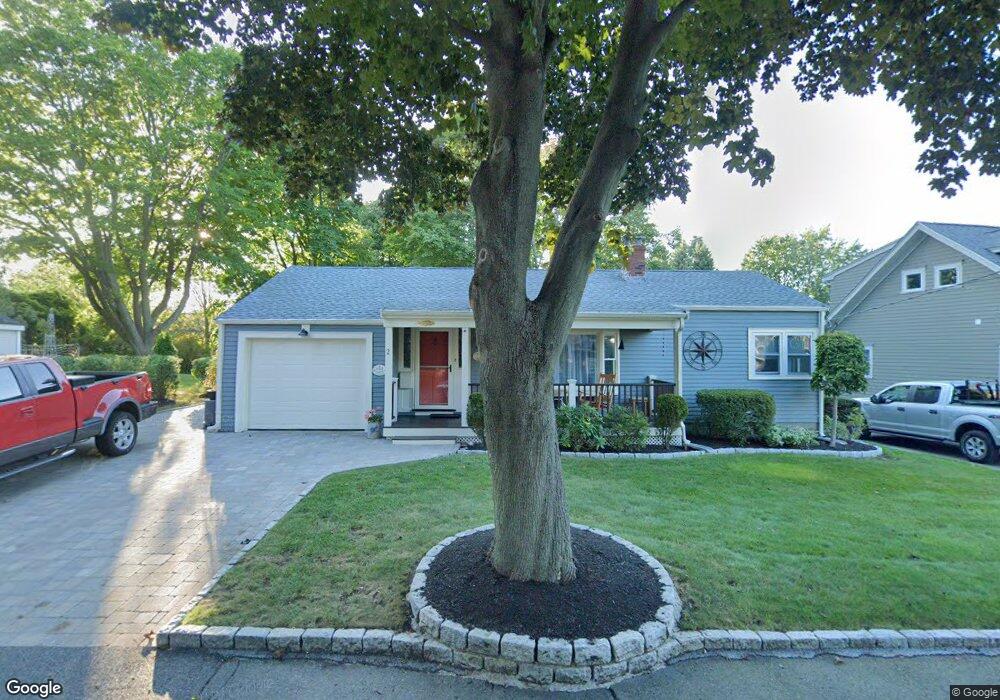
2 Johns Rd Marblehead, MA 01945
Estimated Value: $871,469 - $1,116,000
3
Beds
3
Baths
1,730
Sq Ft
$561/Sq Ft
Est. Value
About This Home
This home is located at 2 Johns Rd, Marblehead, MA 01945 and is currently estimated at $970,367, approximately $560 per square foot. 2 Johns Rd is a home located in Essex County with nearby schools including Marblehead High School, Marblehead Community Charter Public School, and Tower School.
Ownership History
Date
Name
Owned For
Owner Type
Purchase Details
Closed on
Feb 5, 2019
Sold by
Payne Dorothea J and Mitchell Payne J
Bought by
Dorothea J Payne 2019 Ret
Current Estimated Value
Purchase Details
Closed on
Apr 2, 1993
Sold by
Redding Douglas G and Redding Mary
Bought by
Payne J Mitchell and Mckenna Dorothea
Purchase Details
Closed on
Jun 15, 1988
Sold by
Neilson Paul N
Bought by
Redding Douglas G
Create a Home Valuation Report for This Property
The Home Valuation Report is an in-depth analysis detailing your home's value as well as a comparison with similar homes in the area
Home Values in the Area
Average Home Value in this Area
Purchase History
| Date | Buyer | Sale Price | Title Company |
|---|---|---|---|
| Dorothea J Payne 2019 Ret | -- | -- | |
| Payne J Mitchell | $204,500 | -- | |
| Redding Douglas G | $227,500 | -- |
Source: Public Records
Mortgage History
| Date | Status | Borrower | Loan Amount |
|---|---|---|---|
| Previous Owner | Redding Douglas G | $180,000 | |
| Previous Owner | Redding Douglas G | $50,000 | |
| Previous Owner | Redding Douglas G | $190,000 |
Source: Public Records
Tax History
| Year | Tax Paid | Tax Assessment Tax Assessment Total Assessment is a certain percentage of the fair market value that is determined by local assessors to be the total taxable value of land and additions on the property. | Land | Improvement |
|---|---|---|---|---|
| 2025 | $7,690 | $849,700 | $559,000 | $290,700 |
| 2024 | $7,156 | $798,700 | $600,900 | $197,800 |
| 2023 | $7,149 | $714,900 | $524,000 | $190,900 |
| 2022 | $6,987 | $664,200 | $461,200 | $203,000 |
| 2021 | $6,794 | $652,000 | $447,200 | $204,800 |
| 2020 | $6,084 | $585,600 | $433,200 | $152,400 |
| 2019 | $5,990 | $557,700 | $405,300 | $152,400 |
| 2018 | $5,992 | $543,700 | $391,300 | $152,400 |
| 2017 | $5,525 | $501,800 | $349,400 | $152,400 |
| 2016 | $5,317 | $479,000 | $321,400 | $157,600 |
| 2015 | $4,927 | $444,700 | $307,400 | $137,300 |
| 2014 | $4,430 | $399,500 | $265,500 | $134,000 |
Source: Public Records
Map
Nearby Homes
- 89 Naugus Ave
- 21 Kenneth Rd
- 157 Green St Unit 157
- 4 Broadmere Way
- 9 Lincoln Park
- 1 Knollwood Rd
- 55 Roosevelt Ave
- 3 Frost Ln Unit 1
- 132 Elm St
- 132 Elm St Unit 132
- 6 Mount Vernon St
- 7 Mechanic Ct
- 45 Pleasant St
- 66 Pleasant St Unit 1
- 66 Pleasant St Unit 2
- 5 Winter Island Rd
- 26 Summer St Unit 1
- 9 Darling St
- 30 Haley Rd Unit 1
- 8 Webb St
Your Personal Tour Guide
Ask me questions while you tour the home.