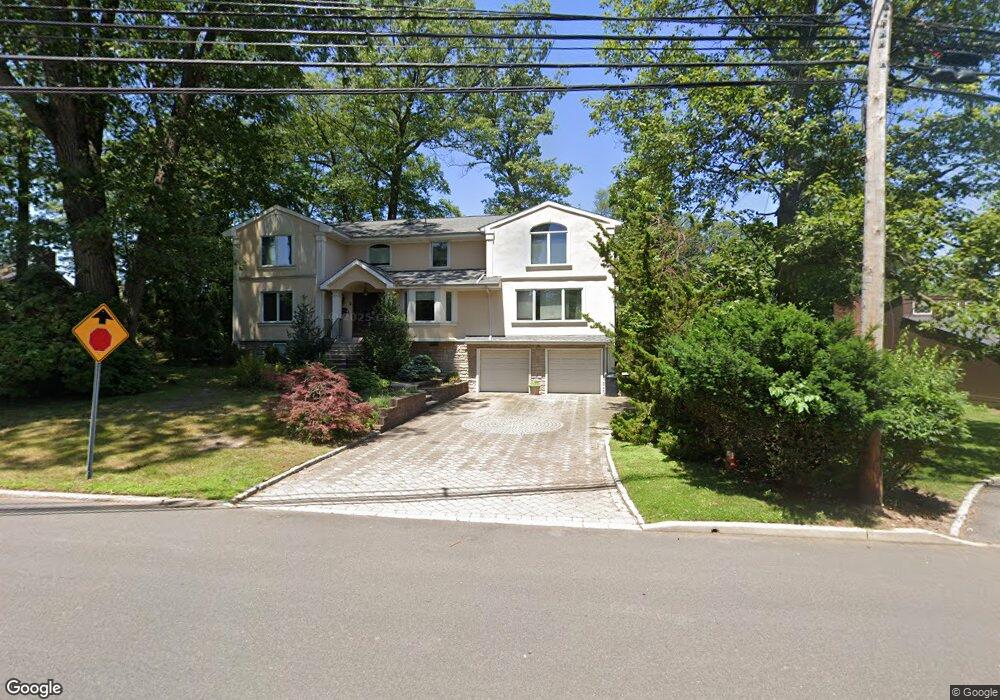
2 Johnson Ave Englewood Cliffs, NJ 07632
Estimated Value: $1,919,000 - $2,298,000
5
Beds
4
Baths
4,188
Sq Ft
$517/Sq Ft
Est. Value
About This Home
This home is located at 2 Johnson Ave, Englewood Cliffs, NJ 07632 and is currently estimated at $2,164,597, approximately $516 per square foot. 2 Johnson Ave is a home located in Bergen County with nearby schools including North Cliff Elementary School, Upper School Elementary School, and Englewood on the Palisades Charter School.
Ownership History
Date
Name
Owned For
Owner Type
Purchase Details
Closed on
Jun 13, 2002
Sold by
Celenza Frank
Bought by
Miguel Ronald and Miguel Elizabeth
Current Estimated Value
Home Financials for this Owner
Home Financials are based on the most recent Mortgage that was taken out on this home.
Original Mortgage
$475,000
Outstanding Balance
$200,982
Interest Rate
6.82%
Estimated Equity
$1,963,615
Purchase Details
Closed on
Jan 3, 1995
Sold by
Campi John
Bought by
Celenzi Frank and Celenzi Michele
Home Financials for this Owner
Home Financials are based on the most recent Mortgage that was taken out on this home.
Original Mortgage
$400,000
Interest Rate
9.23%
Purchase Details
Closed on
Mar 1, 1994
Sold by
Jain Pradip and Jain Monica
Bought by
Campi John and Campi Rosemarie
Home Financials for this Owner
Home Financials are based on the most recent Mortgage that was taken out on this home.
Original Mortgage
$350,000
Interest Rate
7.01%
Create a Home Valuation Report for This Property
The Home Valuation Report is an in-depth analysis detailing your home's value as well as a comparison with similar homes in the area
Home Values in the Area
Average Home Value in this Area
Purchase History
| Date | Buyer | Sale Price | Title Company |
|---|---|---|---|
| Miguel Ronald | $905,000 | -- | |
| Celenzi Frank | $500,000 | -- | |
| Campi John | $450,000 | -- |
Source: Public Records
Mortgage History
| Date | Status | Borrower | Loan Amount |
|---|---|---|---|
| Open | Miguel Ronald | $475,000 | |
| Previous Owner | Celenzi Frank | $400,000 | |
| Previous Owner | Campi John | $350,000 |
Source: Public Records
Tax History Compared to Growth
Tax History
| Year | Tax Paid | Tax Assessment Tax Assessment Total Assessment is a certain percentage of the fair market value that is determined by local assessors to be the total taxable value of land and additions on the property. | Land | Improvement |
|---|---|---|---|---|
| 2025 | $18,209 | $1,576,500 | $860,600 | $715,900 |
| 2024 | $17,988 | $1,576,500 | $860,600 | $715,900 |
| 2023 | $17,704 | $1,576,500 | $860,600 | $715,900 |
| 2022 | $17,704 | $1,576,500 | $860,600 | $715,900 |
| 2021 | $13,609 | $1,576,500 | $860,600 | $715,900 |
| 2020 | $18,146 | $1,576,500 | $860,600 | $715,900 |
| 2019 | $17,042 | $1,576,500 | $860,600 | $715,900 |
| 2018 | $16,443 | $1,576,500 | $860,600 | $715,900 |
| 2017 | $15,733 | $1,576,500 | $860,600 | $715,900 |
| 2016 | $15,434 | $1,576,500 | $860,600 | $715,900 |
| 2015 | $14,661 | $1,576,500 | $860,600 | $715,900 |
| 2014 | $13,716 | $1,576,500 | $860,600 | $715,900 |
Source: Public Records
Map
Nearby Homes
- 4 Johnson Ave
- 341 N Woodland St
- 353 N Woodland St
- 1 Johnson Ave
- 361 N Woodland St
- 6 Johnson Ave
- 74 N Virginia Ct
- 3 S Virginia Ct
- 10 Roberts Rd
- 354 N Woodland St
- 369 N Woodland St
- 1 S Virginia Ct
- 321 N Woodland St
- 70 N Virginia Ct
- 71 N Virginia Ct
- 346 N Woodland St
- 336 N Woodland St
- 377 N Woodland St
- 362 N Woodland St
- 5 S Virginia Ct