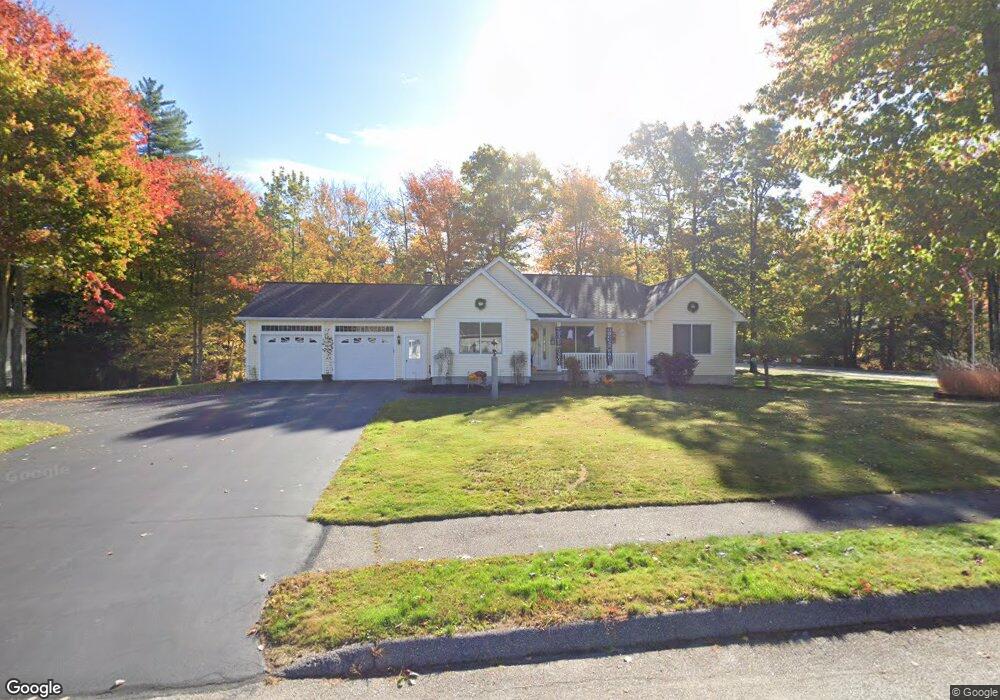
2 Jordan Dr Biddeford, ME 04005
Estimated Value: $549,000 - $689,000
2
Beds
3
Baths
1,604
Sq Ft
$388/Sq Ft
Est. Value
About This Home
This home is located at 2 Jordan Dr, Biddeford, ME 04005 and is currently estimated at $623,097, approximately $388 per square foot. 2 Jordan Dr is a home located in York County with nearby schools including John F Kennedy Memorial School, Biddeford Primary School, and Biddeford Intermediate School.
Ownership History
Date
Name
Owned For
Owner Type
Purchase Details
Closed on
Nov 21, 2011
Sold by
Bisson Jacinthe R and Bisson Norman L
Bought by
Mathieu Karen A and Mathieu Kevin R
Current Estimated Value
Home Financials for this Owner
Home Financials are based on the most recent Mortgage that was taken out on this home.
Original Mortgage
$200,000
Outstanding Balance
$133,701
Interest Rate
3.92%
Mortgage Type
Purchase Money Mortgage
Estimated Equity
$489,396
Create a Home Valuation Report for This Property
The Home Valuation Report is an in-depth analysis detailing your home's value as well as a comparison with similar homes in the area
Home Values in the Area
Average Home Value in this Area
Purchase History
| Date | Buyer | Sale Price | Title Company |
|---|---|---|---|
| Mathieu Karen A | -- | -- | |
| Mathieu Karen A | -- | -- | |
| Mathieu Karen A | -- | -- |
Source: Public Records
Mortgage History
| Date | Status | Borrower | Loan Amount |
|---|---|---|---|
| Open | Mathieu Karen A | $200,000 | |
| Closed | Mathieu Karen A | $200,000 | |
| Previous Owner | Mathieu Karen A | $125,000 | |
| Previous Owner | Mathieu Karen A | $115,000 |
Source: Public Records
Tax History
| Year | Tax Paid | Tax Assessment Tax Assessment Total Assessment is a certain percentage of the fair market value that is determined by local assessors to be the total taxable value of land and additions on the property. | Land | Improvement |
|---|---|---|---|---|
| 2025 | $7,232 | $484,100 | $176,100 | $308,000 |
| 2024 | $6,905 | $485,600 | $176,100 | $309,500 |
| 2023 | $6,332 | $482,600 | $173,100 | $309,500 |
| 2022 | $6,418 | $391,100 | $99,600 | $291,500 |
| 2021 | $5,571 | $336,600 | $85,900 | $250,700 |
| 2020 | $5,548 | $307,100 | $75,600 | $231,500 |
| 2019 | $6,136 | $307,100 | $75,600 | $231,500 |
| 2018 | $897 | $307,100 | $75,600 | $231,500 |
| 2017 | $970 | $278,200 | $75,600 | $202,600 |
| 2016 | $3,197 | $278,200 | $75,600 | $202,600 |
| 2015 | $5,222 | $278,200 | $75,600 | $202,600 |
| 2014 | $5,093 | $278,200 | $75,600 | $202,600 |
| 2013 | -- | $306,600 | $80,600 | $226,000 |
Source: Public Records
Map
Nearby Homes
Your Personal Tour Guide
Ask me questions while you tour the home.