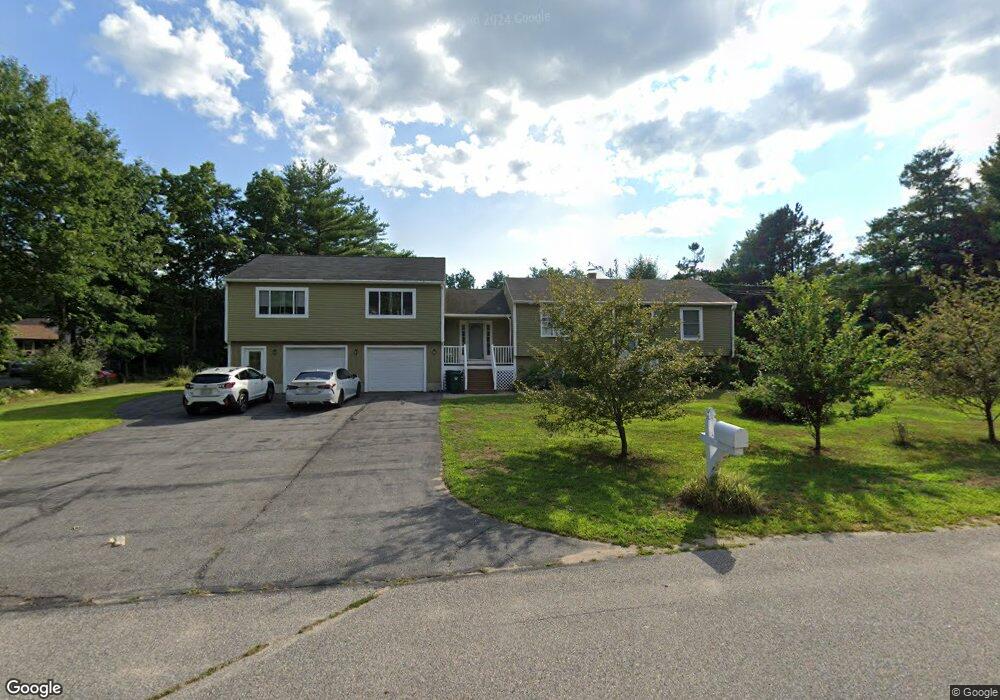
2 Joshua Dr Biddeford, ME 04005
South Biddeford NeighborhoodEstimated Value: $469,844 - $679,000
6
Beds
3
Baths
2,754
Sq Ft
$214/Sq Ft
Est. Value
About This Home
This property at 2 Joshua Dr features 4 bedrooms and 2 bathrooms within a total of 1,800 square feet. The kitchen is equipped with essential appliances including a dishwasher, microwave, refrigerator, and oven. A washer and dryer are also included for added convenience. The living spaces are designed for functionality, with ample room for relaxation and dining. The exterior offers a yard providing outdoor space for activities. Furnished units are available, and the property maintains a smoke-free environment. The rental price is competitive for the area, making it a suitable option for larger families or groups.
Ownership History
Date
Name
Owned For
Owner Type
Purchase Details
Closed on
Mar 4, 2016
Sold by
Dubois Patrick J
Bought by
Varodomh Properties Llc
Current Estimated Value
Purchase Details
Closed on
Aug 31, 2006
Sold by
Tolman Linda A and Tolman Neil B
Bought by
Dubois Phiangchay and Dubois Patrick J
Home Financials for this Owner
Home Financials are based on the most recent Mortgage that was taken out on this home.
Original Mortgage
$178,400
Outstanding Balance
$106,263
Interest Rate
7%
Mortgage Type
Adjustable Rate Mortgage/ARM
Estimated Equity
$484,198
Create a Home Valuation Report for This Property
The Home Valuation Report is an in-depth analysis detailing your home's value as well as a comparison with similar homes in the area
Home Values in the Area
Average Home Value in this Area
Purchase History
| Date | Buyer | Sale Price | Title Company |
|---|---|---|---|
| Varodomh Properties Llc | -- | -- | |
| Dubois Phiangchay | -- | -- |
Source: Public Records
Mortgage History
| Date | Status | Borrower | Loan Amount |
|---|---|---|---|
| Open | Dubois Phiangchay | $178,400 | |
| Closed | Dubois Phiangchay | $44,600 |
Source: Public Records
Property History
| Date | Event | Price | List to Sale | Price per Sq Ft |
|---|---|---|---|---|
| 02/10/2025 02/10/25 | Off Market | -- | -- | -- |
| 02/05/2025 02/05/25 | For Rent | -- | -- | -- |
Tax History
| Year | Tax Paid | Tax Assessment Tax Assessment Total Assessment is a certain percentage of the fair market value that is determined by local assessors to be the total taxable value of land and additions on the property. | Land | Improvement |
|---|---|---|---|---|
| 2025 | $6,133 | $410,500 | $193,300 | $217,200 |
| 2024 | $5,778 | $406,300 | $193,300 | $213,000 |
| 2023 | $5,287 | $403,000 | $190,000 | $213,000 |
| 2022 | $5,240 | $319,300 | $131,000 | $188,300 |
| 2021 | $4,521 | $273,000 | $113,000 | $160,000 |
| 2020 | $4,363 | $242,100 | $95,400 | $146,700 |
| 2019 | $4,837 | $242,100 | $95,400 | $146,700 |
| 2018 | $2,335 | $242,100 | $95,400 | $146,700 |
| 2017 | $4,626 | $230,500 | $95,400 | $135,100 |
| 2016 | $4,578 | $230,500 | $95,400 | $135,100 |
| 2015 | $4,293 | $230,500 | $95,400 | $135,100 |
| 2014 | $4,187 | $230,500 | $95,400 | $135,100 |
| 2013 | -- | $241,300 | $100,600 | $140,700 |
Source: Public Records
Map
Nearby Homes
- 10 Tow Rd
- 6 Proctor Rd Unit B
- 6 Proctor Rd Unit A
- 109 Proctor Rd
- 13 Benson
- 5 Moxie Ln
- 400 West St
- 0 Cole Benson Rd
- 0 Newtown Rd
- 2 Burleigh Ln
- 74 Guinea Rd
- 13 Commodore Dr
- Lot 10 Jasper Ln
- Lot 4 Jasper Ln
- Lot 3 Jasper Ln
- Lot 12 Jasper Ln
- Lot 2 Jasper Ln
- Lot 9 Jasper Ln
- Lot 11 Jasper Ln
- Lot 5 Jasper Ln
Your Personal Tour Guide
Ask me questions while you tour the home.