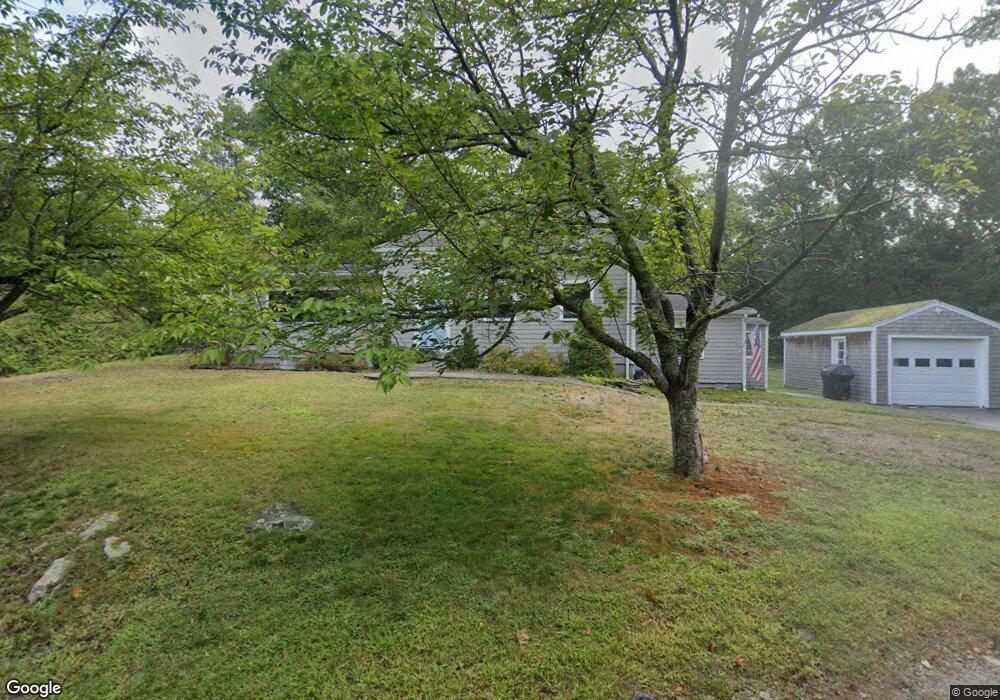
2 Joy Ln Hingham, MA 02043
Estimated Value: $886,900 - $1,137,000
3
Beds
2
Baths
1,681
Sq Ft
$626/Sq Ft
Est. Value
About This Home
This home is located at 2 Joy Ln, Hingham, MA 02043 and is currently estimated at $1,052,475, approximately $626 per square foot. 2 Joy Ln is a home located in Plymouth County with nearby schools including East Elementary School, Hingham Middle School, and Hingham High School.
Ownership History
Date
Name
Owned For
Owner Type
Purchase Details
Closed on
May 13, 2002
Sold by
Concannon John J and Concannon Lauren L
Bought by
Clark Jeffrey E and Clark Jennifer E
Current Estimated Value
Purchase Details
Closed on
Jan 20, 1995
Sold by
Chenoweth Ann M
Bought by
Concannon John J and Concannon Lauren L
Purchase Details
Closed on
Apr 1, 1993
Sold by
Mahoney Michael A
Bought by
Chenoweth Ann M
Create a Home Valuation Report for This Property
The Home Valuation Report is an in-depth analysis detailing your home's value as well as a comparison with similar homes in the area
Purchase History
| Date | Buyer | Sale Price | Title Company |
|---|---|---|---|
| Clark Jeffrey E | $420,000 | -- | |
| Concannon John J | $202,000 | -- | |
| Chenoweth Ann M | $180,000 | -- |
Source: Public Records
Mortgage History
| Date | Status | Borrower | Loan Amount |
|---|---|---|---|
| Open | Chenoweth Ann M | $200,000 | |
| Closed | Chenoweth Ann M | $125,000 |
Source: Public Records
Tax History
| Year | Tax Paid | Tax Assessment Tax Assessment Total Assessment is a certain percentage of the fair market value that is determined by local assessors to be the total taxable value of land and additions on the property. | Land | Improvement |
|---|---|---|---|---|
| 2025 | $7,317 | $684,500 | $475,200 | $209,300 |
| 2024 | $7,089 | $653,400 | $475,200 | $178,200 |
| 2023 | $6,482 | $648,200 | $475,200 | $173,000 |
| 2022 | $6,298 | $544,800 | $396,000 | $148,800 |
| 2021 | $6,153 | $521,400 | $396,000 | $125,400 |
| 2020 | $6,012 | $521,400 | $396,000 | $125,400 |
| 2019 | $6,067 | $513,700 | $396,000 | $117,700 |
| 2018 | $5,832 | $495,500 | $396,000 | $99,500 |
| 2017 | $5,155 | $420,800 | $333,900 | $86,900 |
| 2016 | $5,233 | $419,000 | $318,000 | $101,000 |
| 2015 | $5,062 | $404,000 | $303,000 | $101,000 |
Source: Public Records
Map
Nearby Homes
- 88 East St
- 77 East St
- 14 Chamberlain Run
- 14A Chamberlain Run
- 98 East St
- 69 East St
- 22 Chamberlain Run
- 102 East St
- 20 Chamberlain Run
- 74 East St
- 18 Chamberlain Run
- 12 Chamberlain Run
- 16 Chamberlain Run
- 3 Rockwood Rd
- 10 Chamberlain Run
- 108 East St
- 5 Glenwood Rd
- 5 Glenwood Rd Unit 5
- 115 East St
- 105 East St
Your Personal Tour Guide
Ask me questions while you tour the home.