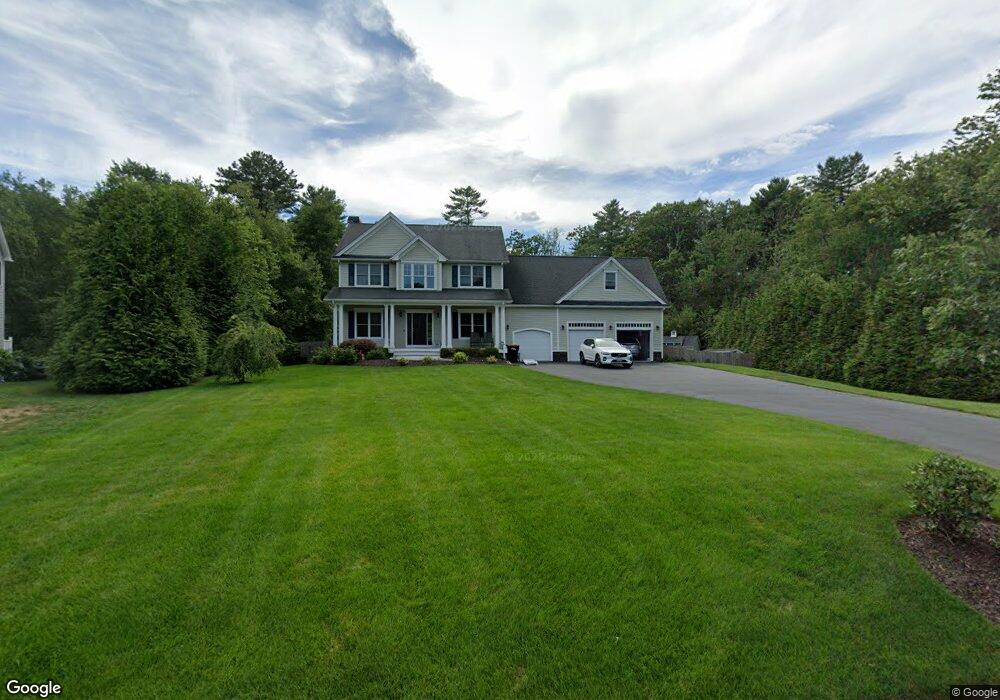
2 Key West Blvd Rehoboth, MA 02769
Estimated Value: $794,013 - $889,000
3
Beds
3
Baths
2,288
Sq Ft
$364/Sq Ft
Est. Value
About This Home
This home is located at 2 Key West Blvd, Rehoboth, MA 02769 and is currently estimated at $833,338, approximately $364 per square foot. 2 Key West Blvd is a home located in Bristol County with nearby schools including Dighton-Rehoboth Regional High School and Cedar Brook School.
Ownership History
Date
Name
Owned For
Owner Type
Purchase Details
Closed on
Mar 4, 2025
Sold by
Ferreira Nicholas and Ferreira Chelsea
Bought by
Chelsea Ferreira Ret and Ferreira
Current Estimated Value
Purchase Details
Closed on
May 27, 2020
Sold by
Ferreira Chelsea and Ferreira Nicholas
Bought by
Ferreira Nicholas and Ferreira Chelsea
Home Financials for this Owner
Home Financials are based on the most recent Mortgage that was taken out on this home.
Original Mortgage
$340,000
Interest Rate
3.2%
Mortgage Type
New Conventional
Purchase Details
Closed on
Mar 9, 2010
Sold by
Cedar Hill Estates Llc and Community Bk
Bought by
Community Bk
Create a Home Valuation Report for This Property
The Home Valuation Report is an in-depth analysis detailing your home's value as well as a comparison with similar homes in the area
Home Values in the Area
Average Home Value in this Area
Purchase History
| Date | Buyer | Sale Price | Title Company |
|---|---|---|---|
| Chelsea Ferreira Ret | -- | None Available | |
| Chelsea Ferreira Ret | -- | None Available | |
| Ferreira Nicholas | -- | None Available | |
| Community Bk | $430,000 | -- | |
| Community Bk | $430,000 | -- | |
| Community Bk | $430,000 | -- |
Source: Public Records
Mortgage History
| Date | Status | Borrower | Loan Amount |
|---|---|---|---|
| Previous Owner | Ferreira Nicholas | $340,000 |
Source: Public Records
Tax History
| Year | Tax Paid | Tax Assessment Tax Assessment Total Assessment is a certain percentage of the fair market value that is determined by local assessors to be the total taxable value of land and additions on the property. | Land | Improvement |
|---|---|---|---|---|
| 2025 | $7,581 | $679,900 | $172,800 | $507,100 |
| 2024 | $7,788 | $685,600 | $190,100 | $495,500 |
| 2023 | $7,182 | $620,200 | $186,100 | $434,100 |
| 2022 | $6,927 | $546,700 | $177,700 | $369,000 |
| 2021 | $5,474 | $506,500 | $161,400 | $345,100 |
| 2020 | $4,883 | $506,500 | $161,400 | $345,100 |
| 2018 | $4,514 | $458,500 | $153,600 | $304,900 |
| 2017 | $5,271 | $419,700 | $153,600 | $266,100 |
| 2016 | $5,099 | $419,700 | $153,600 | $266,100 |
| 2015 | $5,253 | $426,700 | $175,700 | $251,000 |
| 2014 | $2,077 | $167,000 | $167,000 | $0 |
Source: Public Records
Map
Nearby Homes
- 2 Key Blvd W
- 2 Key Blvd W Unit 13
- 6 Key West Blvd
- 125 Cedar St
- 3 Key West Blvd
- 3 Key West Blvd Unit 3
- 131 Cedar St
- 127 Cedar St
- Lot 3 Key Blvd W
- Lot 4 Key Blvd W
- 123 Cedar St
- 136 Cedar St
- 141 Cedar St
- 132 Cedar St
- 4 Duval St
- 8 Duval St
- 1 Duval St
- Lot 11 Duval St
- 11 Duval St
- 10 Key West Boulevard Blvd
Your Personal Tour Guide
Ask me questions while you tour the home.