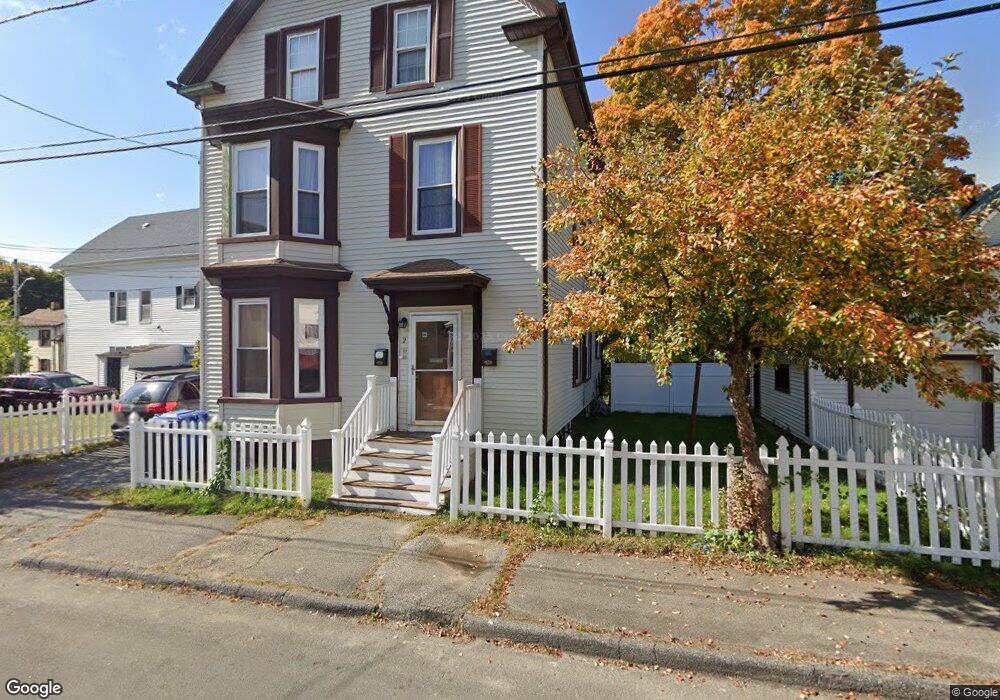
2 Kimball St Unit 1 Haverhill, MA 01830
Lower Acres NeighborhoodEstimated Value: $600,432 - $811,000
2
Beds
1
Bath
2,424
Sq Ft
$289/Sq Ft
Est. Value
About This Home
This home is located at 2 Kimball St Unit 1, Haverhill, MA 01830 and is currently estimated at $701,108, approximately $289 per square foot. 2 Kimball St Unit 1 is a home located in Essex County with nearby schools including Pentucket Lake Elementary School.
Ownership History
Date
Name
Owned For
Owner Type
Purchase Details
Closed on
May 23, 2023
Sold by
Buteau Marie E
Bought by
Marie Elsie Buteau Lt
Current Estimated Value
Purchase Details
Closed on
Nov 12, 2002
Sold by
Reyes Abel
Bought by
Buteau Marie Elsie
Purchase Details
Closed on
Dec 21, 2001
Sold by
Mccarthy William T
Bought by
Reyes Abel
Purchase Details
Closed on
Jul 31, 2001
Sold by
Miles Evonne and Miles Joseph
Bought by
Mccarthy William T
Purchase Details
Closed on
Sep 28, 1988
Sold by
Duchemin Clement M
Bought by
Miles Joseph M
Create a Home Valuation Report for This Property
The Home Valuation Report is an in-depth analysis detailing your home's value as well as a comparison with similar homes in the area
Home Values in the Area
Average Home Value in this Area
Purchase History
| Date | Buyer | Sale Price | Title Company |
|---|---|---|---|
| Marie Elsie Buteau Lt | -- | None Available | |
| Buteau Marie Elsie | $275,000 | -- | |
| Reyes Abel | $223,000 | -- | |
| Mccarthy William T | $170,000 | -- | |
| Miles Joseph M | $140,000 | -- |
Source: Public Records
Mortgage History
| Date | Status | Borrower | Loan Amount |
|---|---|---|---|
| Previous Owner | Miles Joseph M | $279,500 | |
| Previous Owner | Miles Joseph M | $34,900 | |
| Previous Owner | Miles Joseph M | $15,243 |
Source: Public Records
Tax History Compared to Growth
Tax History
| Year | Tax Paid | Tax Assessment Tax Assessment Total Assessment is a certain percentage of the fair market value that is determined by local assessors to be the total taxable value of land and additions on the property. | Land | Improvement |
|---|---|---|---|---|
| 2025 | $5,737 | $535,700 | $145,500 | $390,200 |
| 2024 | $5,292 | $497,400 | $144,000 | $353,400 |
| 2023 | $5,018 | $450,000 | $131,700 | $318,300 |
| 2022 | $4,827 | $379,500 | $119,500 | $260,000 |
| 2021 | $4,541 | $337,900 | $104,200 | $233,700 |
| 2020 | $4,323 | $317,900 | $96,500 | $221,400 |
| 2019 | $4,018 | $288,000 | $84,200 | $203,800 |
| 2018 | $3,843 | $269,500 | $79,600 | $189,900 |
| 2017 | $3,283 | $219,000 | $64,300 | $154,700 |
| 2016 | $3,364 | $219,000 | $64,300 | $154,700 |
| 2015 | $3,147 | $205,000 | $64,300 | $140,700 |
Source: Public Records
Map
Nearby Homes