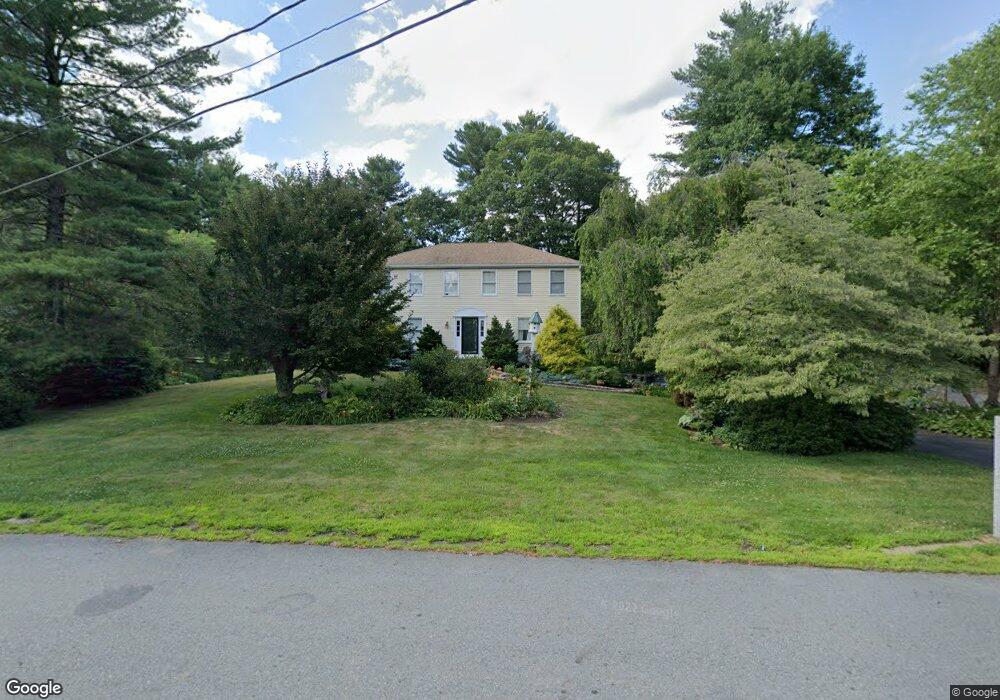
2 Kings Row Ashland, MA 01721
Estimated Value: $803,098 - $940,000
4
Beds
3
Baths
2,104
Sq Ft
$411/Sq Ft
Est. Value
About This Home
This home is located at 2 Kings Row, Ashland, MA 01721 and is currently estimated at $865,025, approximately $411 per square foot. 2 Kings Row is a home located in Middlesex County with nearby schools including William Pittaway Elementary School, David Mindess Elementary School, and Henry E. Warren Elementary School.
Ownership History
Date
Name
Owned For
Owner Type
Purchase Details
Closed on
Apr 24, 2015
Sold by
Desalvo John and Desalvo Mary E
Bought by
John E Desalvo Ret
Current Estimated Value
Purchase Details
Closed on
Jul 29, 1985
Bought by
Desalvo John and Desalvo Mary
Create a Home Valuation Report for This Property
The Home Valuation Report is an in-depth analysis detailing your home's value as well as a comparison with similar homes in the area
Home Values in the Area
Average Home Value in this Area
Purchase History
| Date | Buyer | Sale Price | Title Company |
|---|---|---|---|
| John E Desalvo Ret | -- | -- | |
| Desalvo John | $168,500 | -- |
Source: Public Records
Mortgage History
| Date | Status | Borrower | Loan Amount |
|---|---|---|---|
| Previous Owner | Desalvo John | $188,000 | |
| Previous Owner | Desalvo John | $45,750 | |
| Previous Owner | Desalvo John | $137,800 | |
| Previous Owner | Desalvo John | $12,500 |
Source: Public Records
Tax History
| Year | Tax Paid | Tax Assessment Tax Assessment Total Assessment is a certain percentage of the fair market value that is determined by local assessors to be the total taxable value of land and additions on the property. | Land | Improvement |
|---|---|---|---|---|
| 2025 | $9,182 | $719,000 | $276,200 | $442,800 |
| 2024 | $8,985 | $678,600 | $276,200 | $402,400 |
| 2023 | $8,228 | $597,500 | $263,000 | $334,500 |
| 2022 | $8,312 | $523,400 | $239,100 | $284,300 |
| 2021 | $7,844 | $492,400 | $239,100 | $253,300 |
| 2020 | $12,331 | $471,600 | $239,100 | $232,500 |
| 2019 | $7,359 | $452,000 | $239,100 | $212,900 |
| 2018 | $7,272 | $437,800 | $237,100 | $200,700 |
| 2017 | $7,196 | $430,900 | $235,900 | $195,000 |
| 2016 | $7,065 | $415,600 | $232,900 | $182,700 |
| 2015 | $6,889 | $398,200 | $223,000 | $175,200 |
| 2014 | $6,695 | $385,000 | $189,100 | $195,900 |
Source: Public Records
Map
Nearby Homes
- 0 Oak St
- 66 Cedar Hill Rd
- 9 Garrison Ln
- 203 Pleasant St
- 22 Wilbur Dr
- 2 Braeburn Ln
- 20 Braeburn Ln
- 96 Pleasant St Unit 96
- 0 Cross St
- 0 Oregon Rd
- 98 Southville Rd
- 7 Carolyn Terrace
- 10 Foothill Rd
- 30 Waterville Ln Unit 30
- 32 Waterville Ln Unit 32
- 34 Waterville Ln Unit 34
- 36 Waterville Ln Unit 36
- 14 Waterville Ln Unit 14
- 38 Waterville Ln Unit 38
- 6 Waterville Ln Unit 6
Your Personal Tour Guide
Ask me questions while you tour the home.