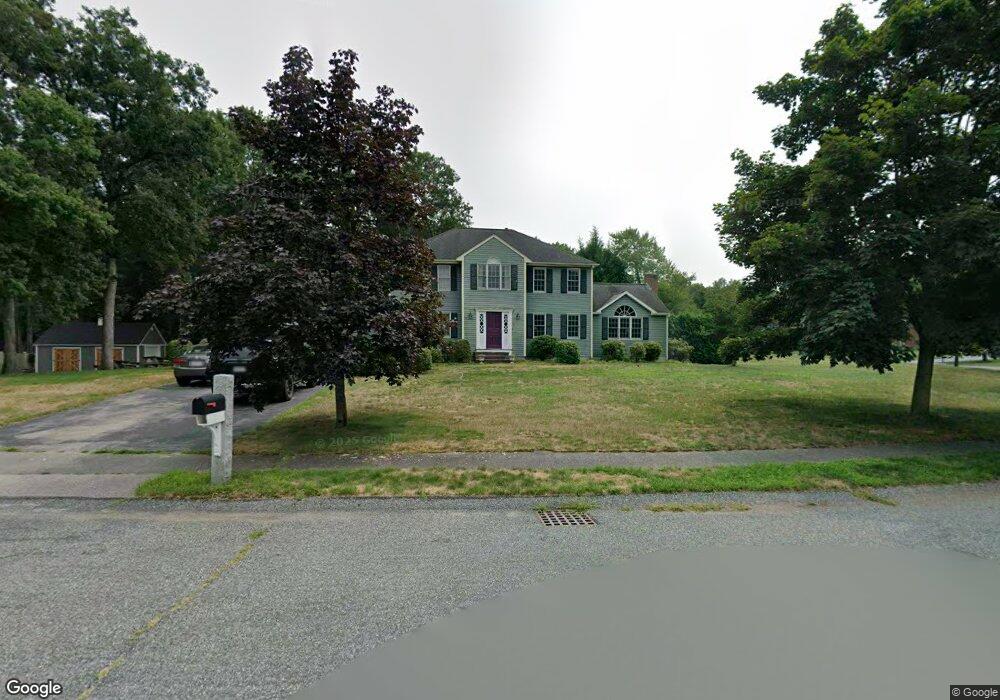
2 Knight Way Mansfield, MA 02048
Estimated Value: $834,472 - $936,000
4
Beds
3
Baths
2,400
Sq Ft
$368/Sq Ft
Est. Value
About This Home
This home is located at 2 Knight Way, Mansfield, MA 02048 and is currently estimated at $883,118, approximately $367 per square foot. 2 Knight Way is a home located in Bristol County with nearby schools including Everett W. Robinson Elementary School, Jordan/Jackson Elementary School, and Harold L. Qualters Middle School.
Ownership History
Date
Name
Owned For
Owner Type
Purchase Details
Closed on
Dec 18, 2018
Sold by
Degrandpre Dawn E and Haring David S
Bought by
Haring David S
Current Estimated Value
Purchase Details
Closed on
Sep 2, 1997
Sold by
Rondo Co Inc
Bought by
Haring David S and Haring Dawn E
Home Financials for this Owner
Home Financials are based on the most recent Mortgage that was taken out on this home.
Original Mortgage
$214,550
Interest Rate
7.41%
Mortgage Type
Purchase Money Mortgage
Purchase Details
Closed on
Mar 3, 1997
Sold by
Massapoag Rt
Bought by
Rondo Co Inc
Create a Home Valuation Report for This Property
The Home Valuation Report is an in-depth analysis detailing your home's value as well as a comparison with similar homes in the area
Home Values in the Area
Average Home Value in this Area
Purchase History
| Date | Buyer | Sale Price | Title Company |
|---|---|---|---|
| Haring David S | -- | -- | |
| Haring David S | $291,342 | -- | |
| Rondo Co Inc | $120,000 | -- |
Source: Public Records
Mortgage History
| Date | Status | Borrower | Loan Amount |
|---|---|---|---|
| Previous Owner | Rondo Co Inc | $260,000 | |
| Previous Owner | Rondo Co Inc | $214,550 | |
| Previous Owner | Rondo Co Inc | $18,500 |
Source: Public Records
Tax History
| Year | Tax Paid | Tax Assessment Tax Assessment Total Assessment is a certain percentage of the fair market value that is determined by local assessors to be the total taxable value of land and additions on the property. | Land | Improvement |
|---|---|---|---|---|
| 2025 | $9,388 | $712,800 | $279,900 | $432,900 |
| 2024 | $9,419 | $697,700 | $292,000 | $405,700 |
| 2023 | $9,104 | $646,100 | $292,000 | $354,100 |
| 2022 | $8,756 | $577,200 | $270,300 | $306,900 |
| 2021 | $8,519 | $554,600 | $225,300 | $329,300 |
| 2020 | $8,383 | $545,800 | $225,300 | $320,500 |
| 2019 | $7,892 | $518,500 | $187,700 | $330,800 |
| 2018 | $7,844 | $503,800 | $179,000 | $324,800 |
| 2017 | $7,357 | $489,800 | $173,900 | $315,900 |
| 2016 | $7,052 | $457,600 | $165,600 | $292,000 |
| 2015 | $6,862 | $442,700 | $165,600 | $277,100 |
Source: Public Records
Map
Nearby Homes
- 150 Gilbert St
- 14 Claire Ave
- 85 Jewell St
- 44 Surrey Dr
- 451R Gilbert St
- 2 Oak St Unit 2B
- 24 Maverick Dr
- 128 Tremont St
- 49 Pheasant Hill Rd
- 71 Richardson Ave
- 25 Shepherd St
- 115 Westfield Dr
- 25 Munroe Dr
- 1769 West St
- 17 Childs Ln
- 57 Vine St
- 345 Richardson Ave
- 89 Oak Crest Dr
- 250 Mansfield Ave Unit 11
- 84 Messenger St
Your Personal Tour Guide
Ask me questions while you tour the home.