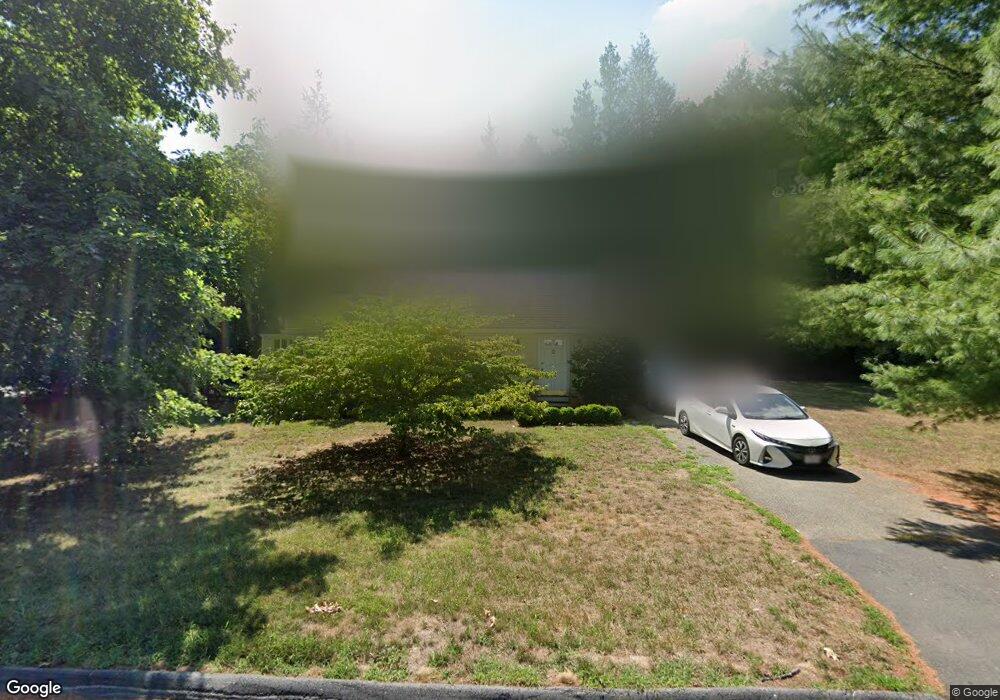
2 Larchmont Ln Lexington, MA 02420
North Lexington NeighborhoodEstimated Value: $962,000 - $1,783,000
2
Beds
3
Baths
1,248
Sq Ft
$1,112/Sq Ft
Est. Value
About This Home
This home is located at 2 Larchmont Ln, Lexington, MA 02420 and is currently estimated at $1,387,467, approximately $1,111 per square foot. 2 Larchmont Ln is a home located in Middlesex County with nearby schools including Fiske Elementary School, William Diamond Middle School, and Lexington High School.
Ownership History
Date
Name
Owned For
Owner Type
Purchase Details
Closed on
Feb 12, 2024
Sold by
Carol Halewood T and Carol Shea
Bought by
Shea Mark W
Current Estimated Value
Purchase Details
Closed on
Jan 26, 1987
Sold by
Shea Paul R
Bought by
Halewood Carol
Home Financials for this Owner
Home Financials are based on the most recent Mortgage that was taken out on this home.
Original Mortgage
$55,000
Interest Rate
9.36%
Mortgage Type
Purchase Money Mortgage
Create a Home Valuation Report for This Property
The Home Valuation Report is an in-depth analysis detailing your home's value as well as a comparison with similar homes in the area
Home Values in the Area
Average Home Value in this Area
Purchase History
| Date | Buyer | Sale Price | Title Company |
|---|---|---|---|
| Shea Mark W | -- | None Available | |
| Carol Halewood T | -- | None Available | |
| Halewood Carol | $60,000 | -- |
Source: Public Records
Mortgage History
| Date | Status | Borrower | Loan Amount |
|---|---|---|---|
| Previous Owner | Halewood Carol | $25,000 | |
| Previous Owner | Halewood Carol | $48,800 | |
| Previous Owner | Halewood Carol | $55,000 |
Source: Public Records
Tax History Compared to Growth
Tax History
| Year | Tax Paid | Tax Assessment Tax Assessment Total Assessment is a certain percentage of the fair market value that is determined by local assessors to be the total taxable value of land and additions on the property. | Land | Improvement |
|---|---|---|---|---|
| 2025 | $11,826 | $967,000 | $689,000 | $278,000 |
| 2024 | $11,429 | $933,000 | $656,000 | $277,000 |
| 2023 | $10,933 | $841,000 | $596,000 | $245,000 |
| 2022 | $10,516 | $762,000 | $542,000 | $220,000 |
| 2021 | $10,490 | $729,000 | $516,000 | $213,000 |
| 2020 | $10,242 | $729,000 | $516,000 | $213,000 |
| 2019 | $9,771 | $692,000 | $492,000 | $200,000 |
| 2018 | $9,281 | $649,000 | $468,000 | $181,000 |
| 2017 | $9,085 | $627,000 | $432,000 | $195,000 |
| 2016 | $8,526 | $584,000 | $411,000 | $173,000 |
| 2015 | $8,203 | $552,000 | $374,000 | $178,000 |
| 2014 | $7,336 | $473,000 | $333,000 | $140,000 |
Source: Public Records
Map
Nearby Homes
- 93 Bedford St Unit 201
- 93 Bedford St Unit 308
- 93 Bedford St Unit 101
- 17 Hamilton Rd
- 103 N Hancock St
- 231 Bedford St
- 24 Vaille Ave
- 45 Hancock St
- 12 Coolidge Ave
- 3a Nowers Rd
- 36 Adams St
- 32 Edgewood Rd Unit 1
- 30 Meriam St Unit 30
- 1900 Massachusetts Ave
- 1894 Massachusetts Ave
- 25 Flintlock Rd
- 32 Forest St
- 101 Burlington St
- 21 Balfour St
- 125 Burlington St