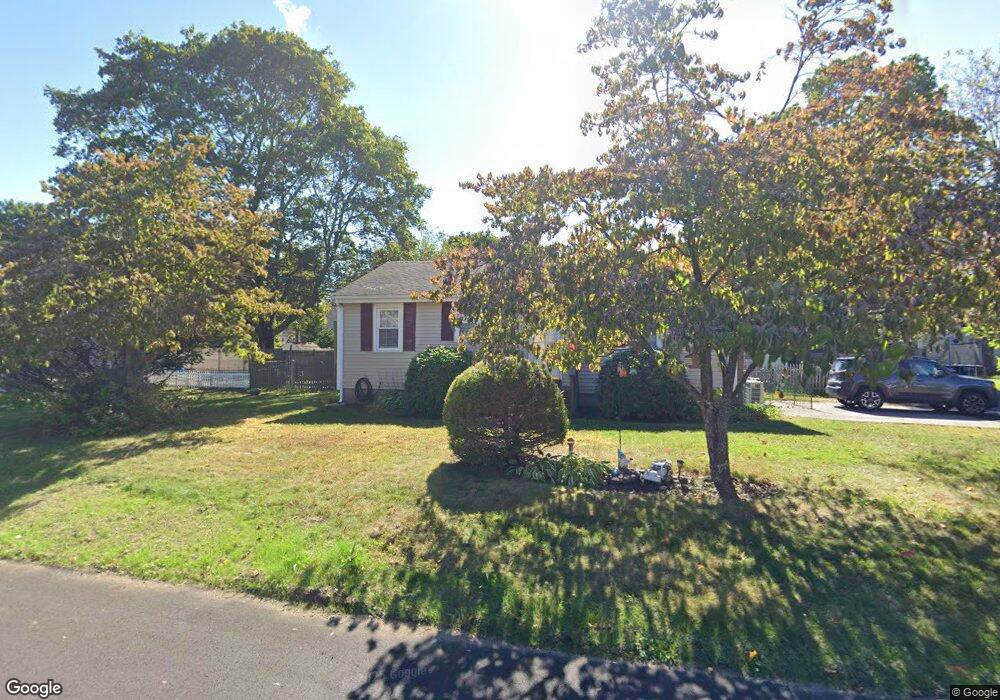
2 Laurel Ave Plainville, MA 02762
Estimated Value: $434,000 - $513,000
3
Beds
1
Bath
864
Sq Ft
$529/Sq Ft
Est. Value
About This Home
This home is located at 2 Laurel Ave, Plainville, MA 02762 and is currently estimated at $456,738, approximately $528 per square foot. 2 Laurel Ave is a home located in Norfolk County with nearby schools including Anna Ware Jackson School, Beatrice H. Wood Elementary School, and Discovery Daycare Center.
Ownership History
Date
Name
Owned For
Owner Type
Purchase Details
Closed on
Oct 1, 2003
Sold by
Bergevine Cindy M
Bought by
Wall Jeffrey A and Wall Kristie
Current Estimated Value
Home Financials for this Owner
Home Financials are based on the most recent Mortgage that was taken out on this home.
Original Mortgage
$238,680
Outstanding Balance
$111,688
Interest Rate
6.25%
Mortgage Type
Purchase Money Mortgage
Estimated Equity
$345,050
Create a Home Valuation Report for This Property
The Home Valuation Report is an in-depth analysis detailing your home's value as well as a comparison with similar homes in the area
Home Values in the Area
Average Home Value in this Area
Purchase History
| Date | Buyer | Sale Price | Title Company |
|---|---|---|---|
| Wall Jeffrey A | $234,000 | -- |
Source: Public Records
Mortgage History
| Date | Status | Borrower | Loan Amount |
|---|---|---|---|
| Open | Wall Jeffrey A | $238,680 |
Source: Public Records
Tax History
| Year | Tax Paid | Tax Assessment Tax Assessment Total Assessment is a certain percentage of the fair market value that is determined by local assessors to be the total taxable value of land and additions on the property. | Land | Improvement |
|---|---|---|---|---|
| 2025 | $42 | $365,500 | $205,000 | $160,500 |
| 2024 | $4,042 | $336,800 | $184,100 | $152,700 |
| 2023 | $3,921 | $314,200 | $184,100 | $130,100 |
| 2022 | $3,704 | $264,000 | $178,300 | $85,700 |
| 2021 | $3,821 | $259,900 | $178,300 | $81,600 |
| 2020 | $3,724 | $253,300 | $178,300 | $75,000 |
| 2019 | $3,784 | $252,800 | $178,300 | $74,500 |
Source: Public Records
Map
Nearby Homes
- 18 Huntington Ave
- 0 Berry St
- 1222 South St
- 19 Chestnut Lot 0
- 20 Field Cir
- 11 Amber Dr
- 11 Crestwood Ave
- 613 West St
- 19 Valerie Dr
- 5 Farm Hill Ln
- 160 Washington St Unit 22
- 158 Washington St
- 126 Washington St
- 130 Washington St
- 124 Washington St
- 20 South St
- 102 High St
- 20 Woodridge St
- 28 Sunset Ln
- 440 Chestnut St
Your Personal Tour Guide
Ask me questions while you tour the home.