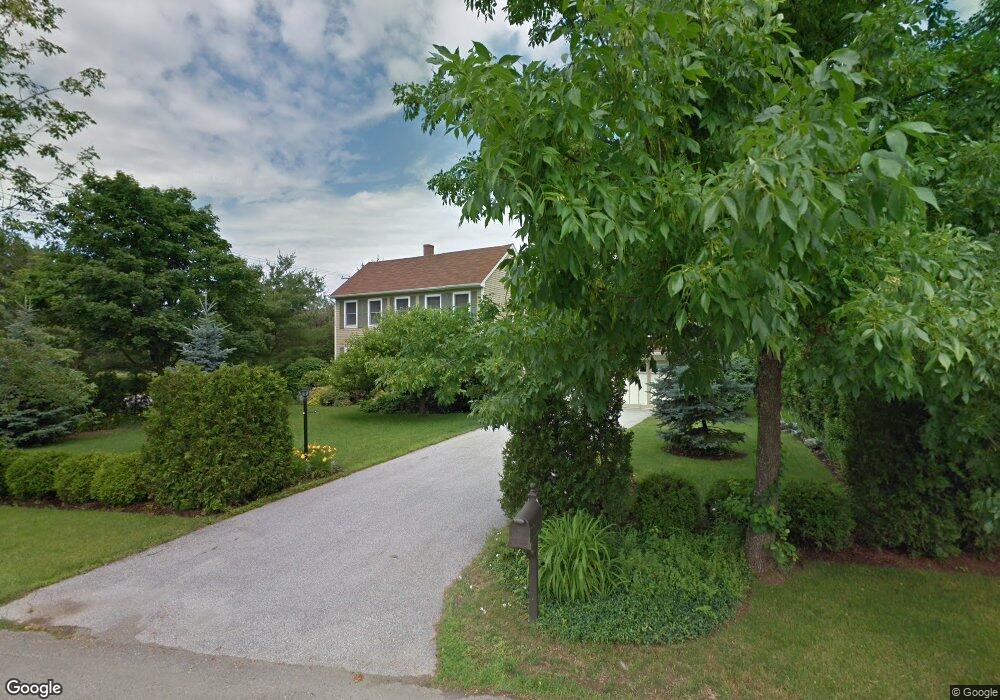
2 Laurel Cir Bangor, ME 04401
Central Bangor NeighborhoodEstimated Value: $339,000 - $438,000
4
Beds
2
Baths
1,700
Sq Ft
$224/Sq Ft
Est. Value
About This Home
This home is located at 2 Laurel Cir, Bangor, ME 04401 and is currently estimated at $380,182, approximately $223 per square foot. 2 Laurel Cir is a home located in Penobscot County with nearby schools including Fruit Street School, Mary Snow School, and William S. Cohen School.
Ownership History
Date
Name
Owned For
Owner Type
Purchase Details
Closed on
Nov 13, 2014
Sold by
Rand Carol
Bought by
Carol J Rand Lt
Current Estimated Value
Purchase Details
Closed on
Jun 19, 2013
Sold by
Olds Patrick W Est
Bought by
Rand Carol
Home Financials for this Owner
Home Financials are based on the most recent Mortgage that was taken out on this home.
Original Mortgage
$159,125
Outstanding Balance
$112,990
Interest Rate
3.45%
Mortgage Type
New Conventional
Estimated Equity
$267,192
Create a Home Valuation Report for This Property
The Home Valuation Report is an in-depth analysis detailing your home's value as well as a comparison with similar homes in the area
Home Values in the Area
Average Home Value in this Area
Purchase History
| Date | Buyer | Sale Price | Title Company |
|---|---|---|---|
| Carol J Rand Lt | -- | -- | |
| Rand Carol | -- | -- |
Source: Public Records
Mortgage History
| Date | Status | Borrower | Loan Amount |
|---|---|---|---|
| Open | Rand Carol | $159,125 |
Source: Public Records
Tax History
| Year | Tax Paid | Tax Assessment Tax Assessment Total Assessment is a certain percentage of the fair market value that is determined by local assessors to be the total taxable value of land and additions on the property. | Land | Improvement |
|---|---|---|---|---|
| 2024 | $6,635 | $357,700 | $49,500 | $308,200 |
| 2023 | $6,220 | $324,800 | $49,500 | $275,300 |
| 2022 | $5,581 | $273,600 | $49,500 | $224,100 |
| 2021 | $5,323 | $238,700 | $45,800 | $192,900 |
| 2020 | $5,415 | $233,400 | $45,800 | $187,600 |
| 2019 | $5,210 | $226,500 | $45,800 | $180,700 |
| 2018 | $5,079 | $221,300 | $45,800 | $175,500 |
| 2017 | $4,722 | $209,400 | $39,500 | $169,900 |
| 2016 | $4,613 | $205,000 | $39,500 | $165,500 |
| 2015 | $4,500 | $205,000 | $39,500 | $165,500 |
| 2014 | $4,415 | $202,500 | $39,500 | $163,000 |
| 2013 | $4,249 | $204,300 | $39,500 | $164,800 |
Source: Public Records
Map
Nearby Homes
- 539 Kenduskeag Ave Unit B3
- 172 Falvey St
- 564 Kenduskeag Ave
- 169 Thornton Rd
- 34 Jessie St
- 546 Broadway
- 22 14th St
- 34 Winter St
- 20 Earle Ave
- 98 Fountain St
- 50 14th St
- 134 Kenduskeag Ave
- 253 Ohio St
- 64 Congress St
- 826 Ohio St Unit 6
- 850 Ohio St
- 152 E Broadway Extension
- 17 Prentiss St
- 229 Center St
- 28 Firefly Ln
Your Personal Tour Guide
Ask me questions while you tour the home.