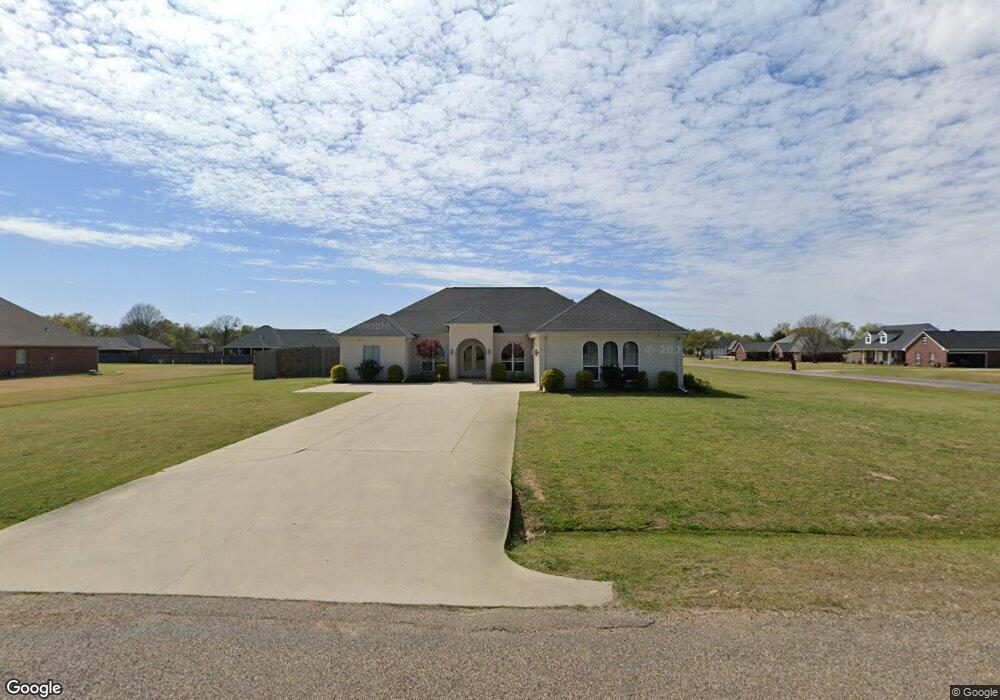
2 Lazy Ln Texarkana, TX 75503
Estimated Value: $481,000 - $586,140
3
Beds
3
Baths
3,237
Sq Ft
$159/Sq Ft
Est. Value
About This Home
This home is located at 2 Lazy Ln, Texarkana, TX 75503 and is currently estimated at $514,285, approximately $158 per square foot. 2 Lazy Ln is a home located in Bowie County with nearby schools including Margaret Fischer Davis Elementary School, Pleasant Grove Intermediate School, and Pleasant Grove Middle School.
Ownership History
Date
Name
Owned For
Owner Type
Purchase Details
Closed on
Jun 1, 2018
Sold by
Ridling William
Bought by
Friday Charles Edwin and Friday Jamie Demedio
Current Estimated Value
Home Financials for this Owner
Home Financials are based on the most recent Mortgage that was taken out on this home.
Original Mortgage
$306,990
Outstanding Balance
$224,082
Interest Rate
4.4%
Mortgage Type
VA
Estimated Equity
$290,203
Purchase Details
Closed on
Oct 19, 2017
Sold by
Watkins Barney
Bought by
Ridling William and Ridling Betty
Home Financials for this Owner
Home Financials are based on the most recent Mortgage that was taken out on this home.
Original Mortgage
$165,000
Interest Rate
3.78%
Mortgage Type
New Conventional
Purchase Details
Closed on
Dec 23, 2014
Sold by
Twin City Construction Llc
Bought by
Watkins Barney and Watkins Erin
Purchase Details
Closed on
Jul 31, 2014
Sold by
Eddie Rochelle & Sons Inc
Bought by
Twin City Construction Llc
Create a Home Valuation Report for This Property
The Home Valuation Report is an in-depth analysis detailing your home's value as well as a comparison with similar homes in the area
Home Values in the Area
Average Home Value in this Area
Purchase History
| Date | Buyer | Sale Price | Title Company |
|---|---|---|---|
| Friday Charles Edwin | -- | None Available | |
| Ridling William | -- | None Available | |
| Watkins Barney | -- | Stewart Title | |
| Twin City Construction Llc | -- | Stewart Title |
Source: Public Records
Mortgage History
| Date | Status | Borrower | Loan Amount |
|---|---|---|---|
| Open | Friday Charles Edwin | $306,990 | |
| Previous Owner | Ridling William | $165,000 |
Source: Public Records
Tax History Compared to Growth
Tax History
| Year | Tax Paid | Tax Assessment Tax Assessment Total Assessment is a certain percentage of the fair market value that is determined by local assessors to be the total taxable value of land and additions on the property. | Land | Improvement |
|---|---|---|---|---|
| 2025 | $7,699 | $571,214 | $35,000 | $536,214 |
| 2024 | $7,699 | $567,053 | $35,000 | $532,053 |
| 2023 | $8,632 | $518,531 | $35,000 | $483,531 |
| 2022 | $8,766 | $467,628 | $35,000 | $432,628 |
| 2021 | $8,151 | $408,927 | $35,000 | $373,927 |
| 2020 | $7,856 | $391,371 | $35,000 | $356,371 |
| 2019 | $7,778 | $374,653 | $35,000 | $339,653 |
| 2018 | $7,511 | $365,076 | $35,000 | $330,076 |
| 2017 | $7,906 | $384,721 | $35,000 | $349,721 |
| 2016 | $7,392 | $359,721 | $35,000 | $324,721 |
| 2015 | $252 | $35,000 | $35,000 | $0 |
| 2014 | $252 | $12,000 | $12,000 | $0 |
Source: Public Records
Map
Nearby Homes
- 6917 Woodmere Ct
- 6826 Maple View Ln
- 6814 Maple View Ln
- 8414 Mandarin Cove
- 8412 Mandarin Cove
- 8623 N Kings Hwy
- 33 Leggett Dr
- 8210 Teal Rd
- 8405 Mandarin Cove
- 37 Leggett Dr
- Lot 2 Blk 2 Cooper Lane Est III
- 6703 Richmond Rd
- 8204 Teal Rd
- 8203 Teal Rd
- 8304 Greenhead Dr
- 8112 Gadwall Trail
- 8102 Gadwall Trail
- 8109 Gadwall Trail
- 6714 Lawson Cir
- 6003 Wilshire Dr
- 4 Lazy Ln
- 5004 Rochelle Ln
- 5102 Rochelle Ln
- 5201 Rolling Hills
- 5104 Rochelle Ln
- 5203 Rolling Hills
- 5005 Rochelle Ln
- 5010 Rochelle Ln
- 3 Lazy Ln
- 6 Lazy Ln
- 5106 Rochelle Ln
- 5205 Rolling Hills
- 5008 Rochelle Ln
- 5 Lazy Ln
- 5003 Rochelle Ln
- 8 Lazy Ln
- 5204 Rolling Hills
- 5006 Rochelle Ln
- 5207 Rolling Hills
- 5206 Rolling Hills