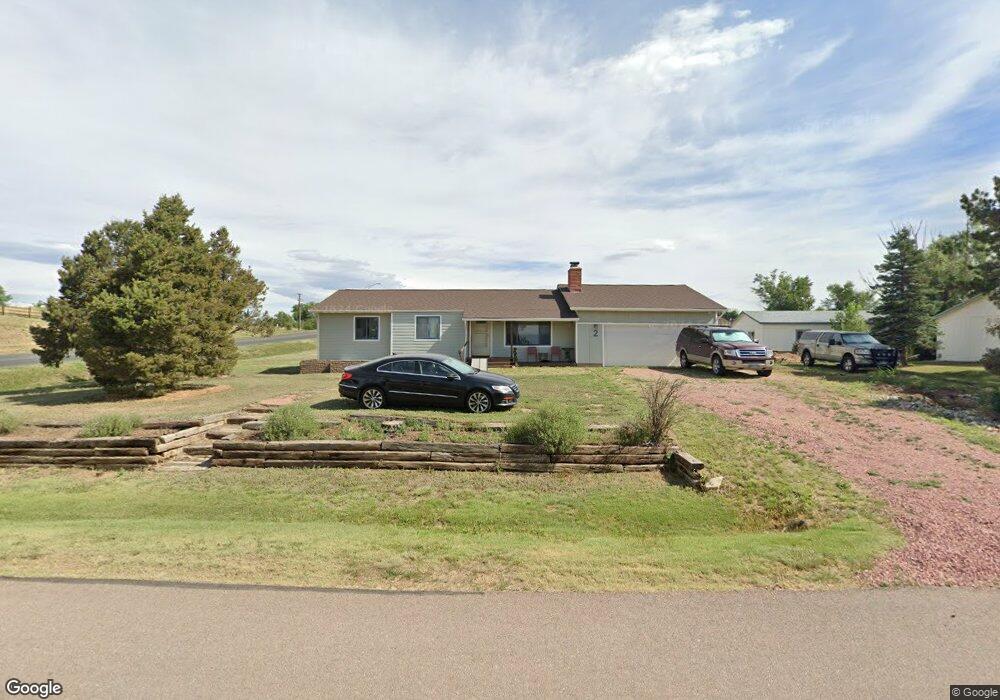
2 Lazy W Rd Fountain, CO 80817
Central Fountain Valley NeighborhoodEstimated Value: $442,221 - $521,000
3
Beds
3
Baths
1,258
Sq Ft
$373/Sq Ft
Est. Value
About This Home
This home is located at 2 Lazy W Rd, Fountain, CO 80817 and is currently estimated at $469,055, approximately $372 per square foot. 2 Lazy W Rd is a home located in El Paso County with nearby schools including Jordahl Elementary School, Fountain Middle School, and Fountain-Fort Carson High School.
Ownership History
Date
Name
Owned For
Owner Type
Purchase Details
Closed on
Jun 5, 2017
Sold by
Fagan Sean P and Fagan Nancy L
Bought by
Begly Nathan A and Begly Amanda J
Current Estimated Value
Home Financials for this Owner
Home Financials are based on the most recent Mortgage that was taken out on this home.
Original Mortgage
$255,375
Outstanding Balance
$212,419
Interest Rate
4.02%
Mortgage Type
VA
Estimated Equity
$256,636
Purchase Details
Closed on
Jul 29, 1999
Sold by
White Donna M
Bought by
Fagan Sean P and Fagan Nancy L
Home Financials for this Owner
Home Financials are based on the most recent Mortgage that was taken out on this home.
Original Mortgage
$124,950
Interest Rate
8%
Mortgage Type
VA
Purchase Details
Closed on
Jun 3, 1993
Bought by
Begly Nathan A
Purchase Details
Closed on
Jul 17, 1987
Bought by
Begly Nathan A
Purchase Details
Closed on
Oct 1, 1981
Bought by
Begly Nathan A
Create a Home Valuation Report for This Property
The Home Valuation Report is an in-depth analysis detailing your home's value as well as a comparison with similar homes in the area
Home Values in the Area
Average Home Value in this Area
Purchase History
| Date | Buyer | Sale Price | Title Company |
|---|---|---|---|
| Begly Nathan A | $250,000 | Empire Title Colorado Spring | |
| Fagan Sean P | $122,500 | North American Title Co | |
| Begly Nathan A | -- | -- | |
| Begly Nathan A | -- | -- | |
| Begly Nathan A | -- | -- |
Source: Public Records
Mortgage History
| Date | Status | Borrower | Loan Amount |
|---|---|---|---|
| Open | Begly Nathan A | $255,375 | |
| Previous Owner | Fagan Sean P | $124,950 |
Source: Public Records
Tax History Compared to Growth
Tax History
| Year | Tax Paid | Tax Assessment Tax Assessment Total Assessment is a certain percentage of the fair market value that is determined by local assessors to be the total taxable value of land and additions on the property. | Land | Improvement |
|---|---|---|---|---|
| 2025 | $1,735 | $31,220 | -- | -- |
| 2024 | $1,567 | $32,340 | $4,690 | $27,650 |
| 2022 | $1,309 | $22,440 | $3,930 | $18,510 |
| 2021 | $1,216 | $23,090 | $4,050 | $19,040 |
| 2020 | $1,092 | $20,290 | $3,540 | $16,750 |
| 2019 | $1,071 | $20,290 | $3,540 | $16,750 |
| 2018 | $869 | $15,890 | $2,590 | $13,300 |
| 2017 | $858 | $15,890 | $2,590 | $13,300 |
| 2016 | $834 | $15,430 | $3,180 | $12,250 |
| 2015 | $835 | $15,430 | $3,180 | $12,250 |
| 2014 | $731 | $13,570 | $3,180 | $10,390 |
Source: Public Records
Map
Nearby Homes
- 12 Arrow H Rd
- 10617 Darneal Dr
- 10555 Flying F Rd
- 10910 Double d Rd
- 11155 Falling Star Rd
- 9430 Bar B Rd
- 9715 Bar B Rd
- 871 Barn Owl Dr
- 843 Hayloft Ln
- 838 Marshall Dr
- 850 Barn Owl Dr
- 908 Candlestar Loop N
- 724 Daffodil St
- 9791 Blaurock Dr
- 9749 Lackawanna St
- 995 Square Dance Ln
- 919 Rancher Dr
- 9729 Lackawanna St
- 10994 Tidal Run Cir
- 9719 Lackawanna St