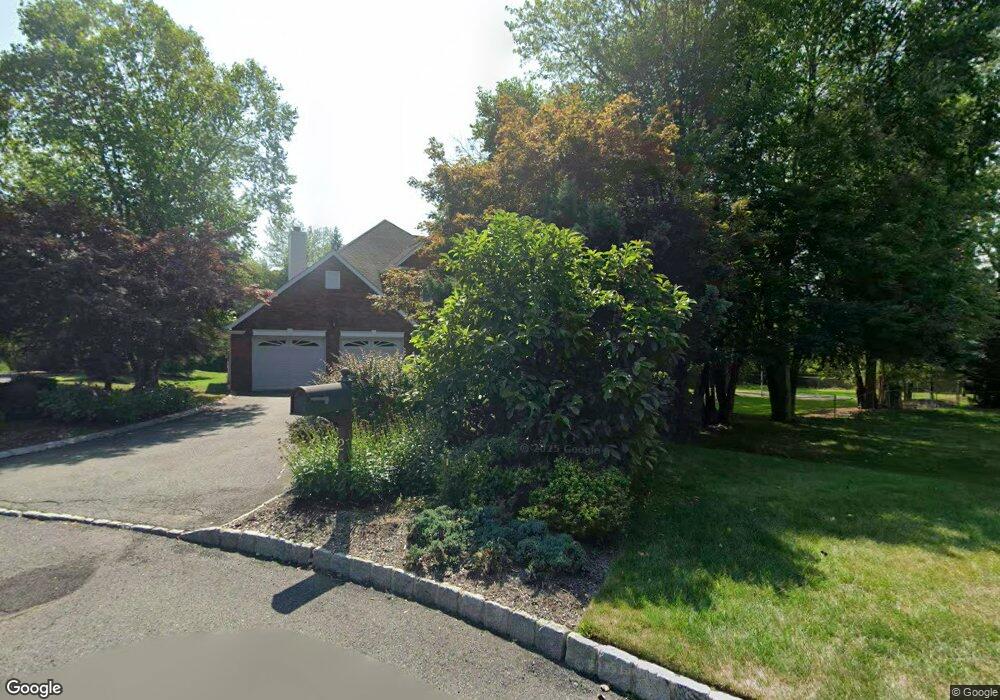
2 Lilac Ct North Caldwell, NJ 07006
Estimated Value: $1,392,000 - $1,558,000
--
Bed
--
Bath
2,942
Sq Ft
$499/Sq Ft
Est. Value
About This Home
This home is located at 2 Lilac Ct, North Caldwell, NJ 07006 and is currently estimated at $1,467,975, approximately $498 per square foot. 2 Lilac Ct is a home located in Essex County with nearby schools including Grandview Elementary School, West Essex Middle School, and West Essex High School.
Ownership History
Date
Name
Owned For
Owner Type
Purchase Details
Closed on
Jun 30, 2011
Sold by
Demattheis Mark and De Mattheis Rosann
Bought by
Fischtrom Bradley Alan and Fischtrom Chrissa Bacsik
Current Estimated Value
Home Financials for this Owner
Home Financials are based on the most recent Mortgage that was taken out on this home.
Original Mortgage
$750,000
Outstanding Balance
$518,164
Interest Rate
4.6%
Mortgage Type
New Conventional
Estimated Equity
$949,811
Create a Home Valuation Report for This Property
The Home Valuation Report is an in-depth analysis detailing your home's value as well as a comparison with similar homes in the area
Home Values in the Area
Average Home Value in this Area
Purchase History
| Date | Buyer | Sale Price | Title Company |
|---|---|---|---|
| Fischtrom Bradley Alan | $937,500 | First Jersey Title Svcs Inc |
Source: Public Records
Mortgage History
| Date | Status | Borrower | Loan Amount |
|---|---|---|---|
| Open | Fischtrom Bradley Alan | $750,000 |
Source: Public Records
Tax History Compared to Growth
Tax History
| Year | Tax Paid | Tax Assessment Tax Assessment Total Assessment is a certain percentage of the fair market value that is determined by local assessors to be the total taxable value of land and additions on the property. | Land | Improvement |
|---|---|---|---|---|
| 2025 | $21,584 | $974,000 | $367,000 | $607,000 |
| 2024 | $21,584 | $974,000 | $367,000 | $607,000 |
| 2022 | $21,223 | $974,000 | $367,000 | $607,000 |
| 2021 | $20,405 | $852,700 | $351,600 | $501,100 |
| 2020 | $20,252 | $852,700 | $351,600 | $501,100 |
| 2019 | $19,979 | $852,700 | $351,600 | $501,100 |
| 2018 | $20,115 | $852,700 | $351,600 | $501,100 |
| 2017 | $19,612 | $852,700 | $351,600 | $501,100 |
| 2016 | $19,169 | $852,700 | $351,600 | $501,100 |
| 2015 | $19,015 | $852,700 | $351,600 | $501,100 |
| 2014 | $18,828 | $852,700 | $351,600 | $501,100 |
Source: Public Records
Map
Nearby Homes