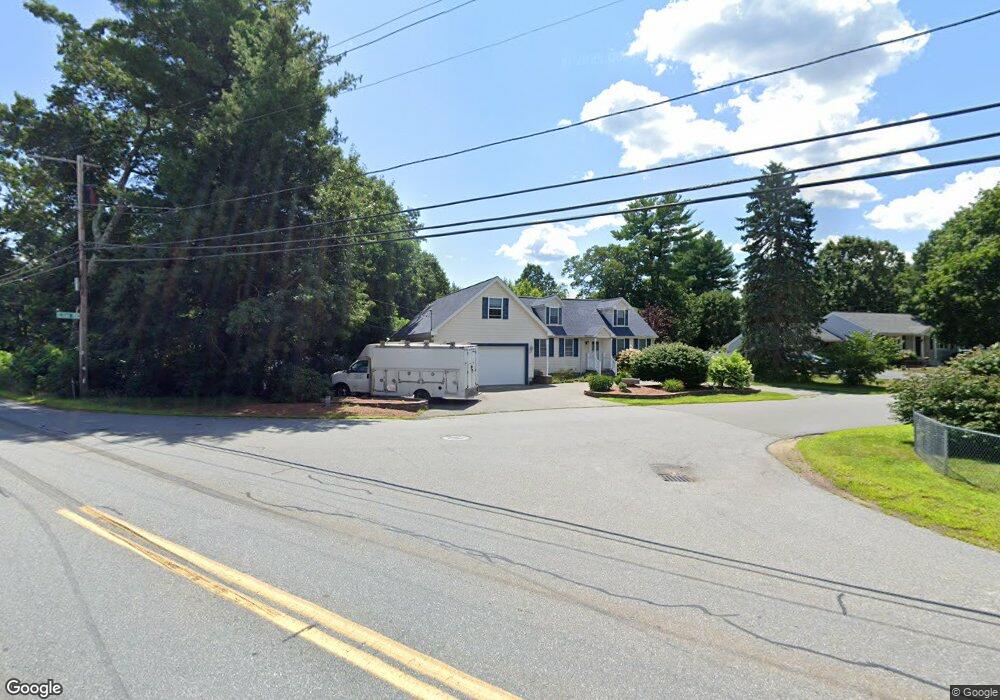
2 Lilac Rd Billerica, MA 01821
Estimated Value: $774,000 - $1,151,000
3
Beds
3
Baths
2,519
Sq Ft
$352/Sq Ft
Est. Value
About This Home
This home is located at 2 Lilac Rd, Billerica, MA 01821 and is currently estimated at $887,575, approximately $352 per square foot. 2 Lilac Rd is a home located in Middlesex County with nearby schools including Billerica Memorial High School.
Ownership History
Date
Name
Owned For
Owner Type
Purchase Details
Closed on
Apr 27, 2000
Sold by
Keri Investment T and Mccrensky
Bought by
Garnder Gregory L and Gardner Nancy E
Current Estimated Value
Home Financials for this Owner
Home Financials are based on the most recent Mortgage that was taken out on this home.
Original Mortgage
$539,600
Outstanding Balance
$187,624
Interest Rate
8.23%
Mortgage Type
Purchase Money Mortgage
Estimated Equity
$699,951
Purchase Details
Closed on
Mar 5, 1985
Bought by
Toner James R and Toner Patricia A
Create a Home Valuation Report for This Property
The Home Valuation Report is an in-depth analysis detailing your home's value as well as a comparison with similar homes in the area
Home Values in the Area
Average Home Value in this Area
Purchase History
| Date | Buyer | Sale Price | Title Company |
|---|---|---|---|
| Garnder Gregory L | $568,000 | -- | |
| Toner James R | $91,900 | -- |
Source: Public Records
Mortgage History
| Date | Status | Borrower | Loan Amount |
|---|---|---|---|
| Open | Toner James R | $200,000 | |
| Closed | Toner James R | $150,000 | |
| Open | Toner James R | $539,600 |
Source: Public Records
Tax History Compared to Growth
Tax History
| Year | Tax Paid | Tax Assessment Tax Assessment Total Assessment is a certain percentage of the fair market value that is determined by local assessors to be the total taxable value of land and additions on the property. | Land | Improvement |
|---|---|---|---|---|
| 2025 | $8,077 | $710,400 | $288,000 | $422,400 |
| 2024 | $7,699 | $681,900 | $282,300 | $399,600 |
| 2023 | $7,640 | $643,600 | $246,400 | $397,200 |
| 2022 | $6,826 | $540,000 | $214,200 | $325,800 |
| 2021 | $13,548 | $501,100 | $189,100 | $312,000 |
| 2020 | $6,408 | $493,300 | $181,300 | $312,000 |
| 2019 | $4,087 | $450,200 | $181,300 | $268,900 |
| 2018 | $6,592 | $412,100 | $161,000 | $251,100 |
| 2017 | $5,539 | $393,100 | $155,900 | $237,200 |
| 2016 | $5,510 | $389,700 | $152,500 | $237,200 |
| 2015 | $5,471 | $389,700 | $152,500 | $237,200 |
| 2014 | $5,444 | $381,000 | $146,100 | $234,900 |
Source: Public Records
Map
Nearby Homes