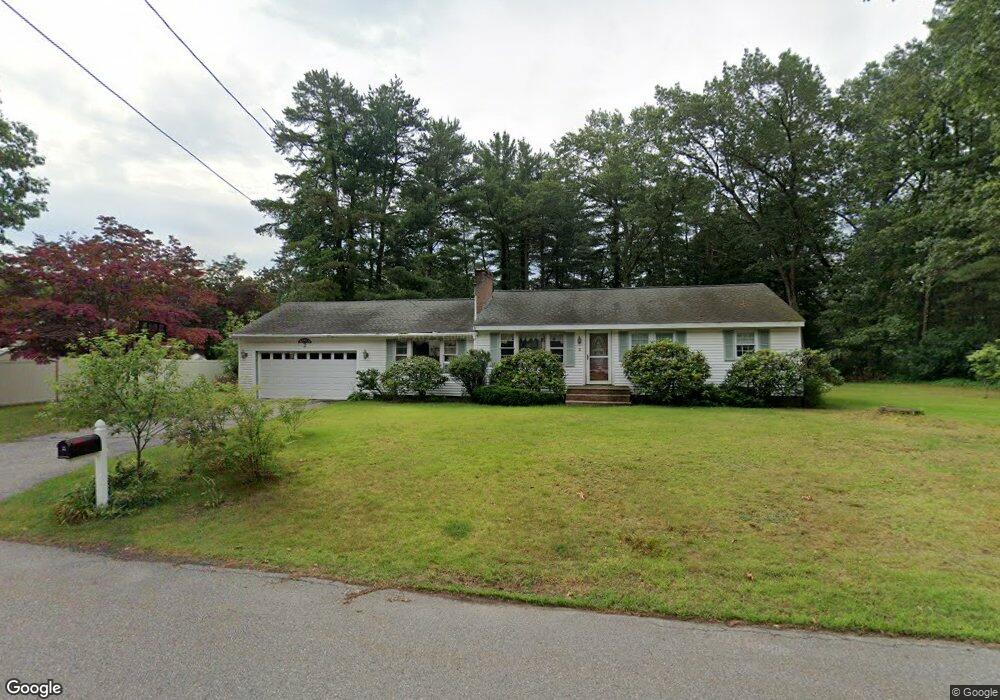
2 Lillian Rd Westford, MA 01886
Estimated Value: $548,000 - $666,000
3
Beds
1
Bath
1,324
Sq Ft
$457/Sq Ft
Est. Value
About This Home
This home is located at 2 Lillian Rd, Westford, MA 01886 and is currently estimated at $605,664, approximately $457 per square foot. 2 Lillian Rd is a home located in Middlesex County with nearby schools including Nabnasset Elementary, Abbot Elementary School, and Stony Brook School.
Ownership History
Date
Name
Owned For
Owner Type
Purchase Details
Closed on
Mar 4, 2016
Sold by
Selway Susan R
Bought by
Selway Susan R and Dinapoli Michael G
Current Estimated Value
Home Financials for this Owner
Home Financials are based on the most recent Mortgage that was taken out on this home.
Original Mortgage
$223,000
Outstanding Balance
$177,436
Interest Rate
3.81%
Mortgage Type
New Conventional
Estimated Equity
$428,228
Purchase Details
Closed on
Jun 1, 1992
Sold by
Federal Home Loan Mortgage Corporation
Bought by
Selway Christopher and Selway Susan
Purchase Details
Closed on
Jul 8, 1991
Sold by
Hogg David W and Hogg Pamela Hogg
Bought by
Fhlmc
Create a Home Valuation Report for This Property
The Home Valuation Report is an in-depth analysis detailing your home's value as well as a comparison with similar homes in the area
Home Values in the Area
Average Home Value in this Area
Purchase History
| Date | Buyer | Sale Price | Title Company |
|---|---|---|---|
| Selway Susan R | -- | -- | |
| Selway Susan R | -- | -- | |
| Selway Christopher | $123,000 | -- | |
| Fhlmc | $162,439 | -- |
Source: Public Records
Mortgage History
| Date | Status | Borrower | Loan Amount |
|---|---|---|---|
| Open | Selway Susan R | $223,000 | |
| Closed | Selway Susan R | $223,000 | |
| Previous Owner | Fhlmc | $144,500 | |
| Previous Owner | Fhlmc | $125,000 | |
| Previous Owner | Fhlmc | $73,000 |
Source: Public Records
Tax History
| Year | Tax Paid | Tax Assessment Tax Assessment Total Assessment is a certain percentage of the fair market value that is determined by local assessors to be the total taxable value of land and additions on the property. | Land | Improvement |
|---|---|---|---|---|
| 2025 | $7,052 | $523,500 | $303,900 | $219,600 |
| 2024 | $6,866 | $498,600 | $289,400 | $209,200 |
| 2023 | $6,849 | $464,000 | $275,700 | $188,300 |
| 2022 | $6,699 | $415,600 | $235,200 | $180,400 |
| 2021 | $22 | $386,000 | $235,200 | $150,800 |
| 2020 | $23 | $386,000 | $235,200 | $150,800 |
| 2019 | $6,235 | $376,500 | $235,200 | $141,300 |
| 2018 | $23 | $362,900 | $225,000 | $137,900 |
| 2017 | $24 | $349,200 | $225,000 | $124,200 |
| 2016 | $5,483 | $336,400 | $212,100 | $124,300 |
| 2015 | $5,208 | $320,700 | $202,900 | $117,800 |
| 2014 | $4,854 | $292,400 | $194,800 | $97,600 |
Source: Public Records
Map
Nearby Homes
- 17 York Ave
- 34 Maple Rd
- 4 Grove St
- 13 Lower Rd
- 4 Swanson Ln
- 23 Monument Hill Rd
- 427 Groton Rd
- 7 Providence Rd
- 8 Galloway Rd
- 43 Abbott Ln
- 1 Appian Way
- 29 Lamplighter Ln
- 40 Grandview Rd
- 13 Long Rd
- 143 Pine Hill Rd
- 62 Main St
- 16 Saint Paul Ln Unit Lot 20
- 2 Courtview Ln Unit 2
- 360 Littleton Rd Unit B7
- 360 Littleton Rd Unit E10
Your Personal Tour Guide
Ask me questions while you tour the home.