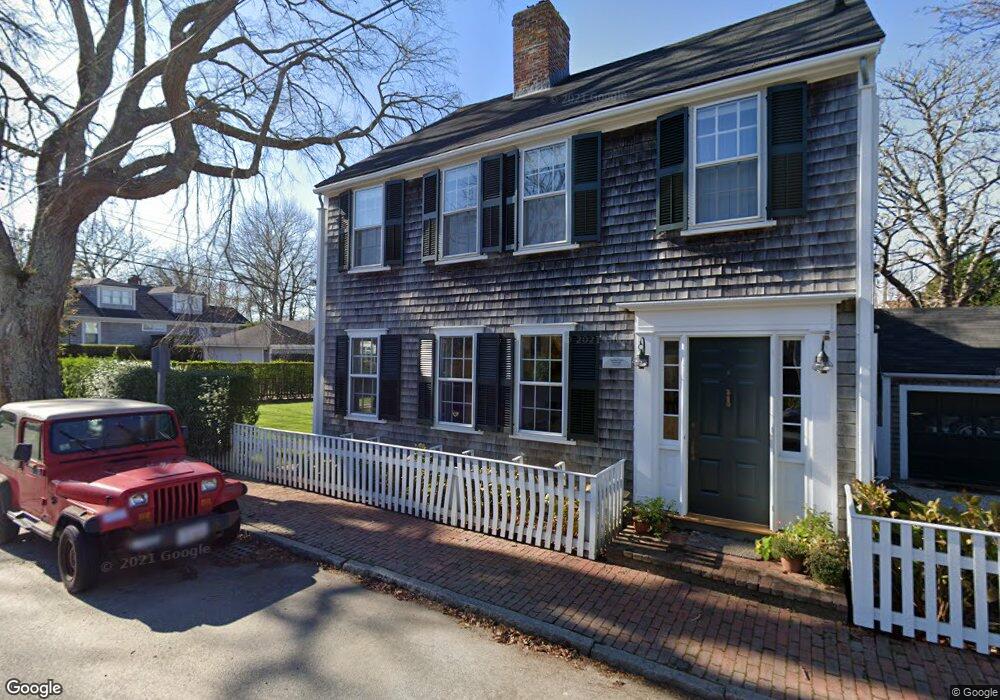
2 Lily St Nantucket, MA 02554
Estimated Value: $1,817,000 - $2,566,000
2
Beds
1
Bath
736
Sq Ft
$2,788/Sq Ft
Est. Value
About This Home
This home is located at 2 Lily St, Nantucket, MA 02554 and is currently estimated at $2,051,743, approximately $2,787 per square foot. 2 Lily St is a home located in Nantucket County with nearby schools including Nantucket Elementary School, Cyrus Peirce Middle School, and Nantucket High School.
Ownership History
Date
Name
Owned For
Owner Type
Purchase Details
Closed on
May 27, 2025
Sold by
Siracuse Helen C and Siracuse Kraig M
Bought by
Kihiczak Alexander
Current Estimated Value
Home Financials for this Owner
Home Financials are based on the most recent Mortgage that was taken out on this home.
Original Mortgage
$1,038,381
Outstanding Balance
$1,034,682
Interest Rate
6.62%
Mortgage Type
Second Mortgage Made To Cover Down Payment
Estimated Equity
$1,017,061
Purchase Details
Closed on
Jan 19, 2012
Sold by
Siracuse Kraig M
Bought by
Siracuse Kraig M and Siracuse Helen C
Purchase Details
Closed on
Jan 13, 2012
Sold by
Taber Mason M and Taber Cynthia K
Bought by
Siracuse Kraig M
Create a Home Valuation Report for This Property
The Home Valuation Report is an in-depth analysis detailing your home's value as well as a comparison with similar homes in the area
Home Values in the Area
Average Home Value in this Area
Purchase History
| Date | Buyer | Sale Price | Title Company |
|---|---|---|---|
| Kihiczak Alexander | $1,900,000 | None Available | |
| Siracuse Kraig M | -- | -- | |
| Siracuse Kraig M | -- | -- | |
| Siracuse Kraig M | $720,000 | -- | |
| Siracuse Kraig M | $720,000 | -- |
Source: Public Records
Mortgage History
| Date | Status | Borrower | Loan Amount |
|---|---|---|---|
| Open | Kihiczak Alexander | $1,038,381 | |
| Closed | Siracuse Kraig M | $0 |
Source: Public Records
Tax History Compared to Growth
Tax History
| Year | Tax Paid | Tax Assessment Tax Assessment Total Assessment is a certain percentage of the fair market value that is determined by local assessors to be the total taxable value of land and additions on the property. | Land | Improvement |
|---|---|---|---|---|
| 2025 | $4,661 | $1,421,000 | $926,300 | $494,700 |
| 2024 | $4,184 | $1,336,700 | $926,300 | $410,400 |
| 2023 | $3,799 | $1,183,500 | $882,000 | $301,500 |
| 2022 | $3,511 | $938,800 | $710,500 | $228,300 |
| 2021 | $3,452 | $951,000 | $735,000 | $216,000 |
| 2020 | $3,281 | $951,000 | $735,000 | $216,000 |
| 2019 | $3,195 | $951,000 | $735,000 | $216,000 |
| 2018 | $3,183 | $901,800 | $735,000 | $166,800 |
| 2017 | $2,891 | $852,900 | $673,800 | $179,100 |
| 2016 | $2,474 | $736,300 | $588,000 | $148,300 |
| 2015 | $2,404 | $665,900 | $517,600 | $148,300 |
| 2014 | $2,406 | $640,000 | $491,700 | $148,300 |
Source: Public Records
Map
Nearby Homes