
Seller's Agent in 2026
Kristen Gaughan
William Raveis R.E. & Home Services
(617) 852-3004
1 in this area
30 Total Sales
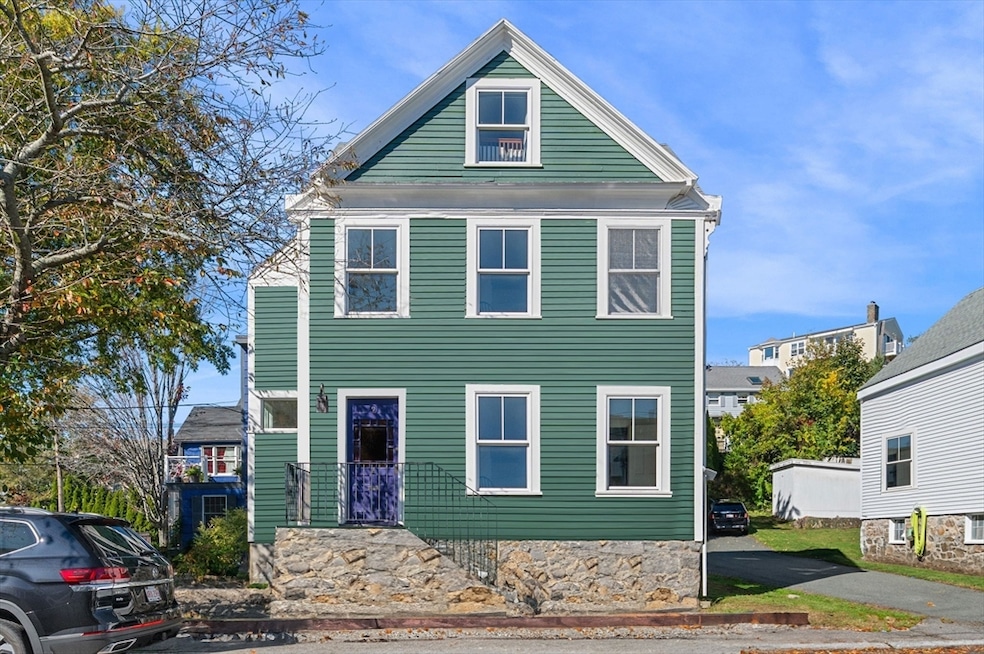


Located just steps from Marblehead Harbor, historic Old Town, and the shops and markets of Washington Street, 2 Lindsey Street offers an exceptional opportunity to live in one of Marblehead’s most desirable coastal neighborhoods.This circa 1880 Victorian-style home features four bedrooms and two and a half baths with the flexibility to be used as a single-family residence or as a home with an accessory apartment. The home offers spacious rooms, hardwood flooring, and classic period details throughout.With a layout that provides versatility for extended family, guests, or home office use, this property is ideal for a buyer seeking value and location. The lot includes off-street parking for up to three vehicles and a small yard area for low-maintenance outdoor enjoyment.
Last Agent to Sell the Property
William Raveis R.E. & Home Services Listed on: 10/28/2025
| Date | Type | Sale Price | Title Company |
|---|---|---|---|
| Quit Claim Deed | $725,000 | -- | |
| Deed | -- | -- | |
| Deed | -- | -- | |
| Deed | $282,500 | -- | |
| Deed | $282,500 | -- | |
| Deed | -- | -- | |
| Deed | -- | -- | |
| Deed | -- | -- |
| Date | Status | Loan Amount | Loan Type |
|---|---|---|---|
| Open | $688,750 | New Conventional | |
| Previous Owner | $291,000 | No Value Available | |
| Previous Owner | $293,108 | FHA |
| Date | Event | Price | List to Sale | Price per Sq Ft |
|---|---|---|---|---|
| 01/02/2026 01/02/26 | Sold | $725,000 | -1.3% | $568 / Sq Ft |
| 11/22/2025 11/22/25 | Pending | -- | -- | -- |
| 10/28/2025 10/28/25 | For Sale | $734,500 | -- | $576 / Sq Ft |
| Year | Tax Paid | Tax Assessment Tax Assessment Total Assessment is a certain percentage of the fair market value that is determined by local assessors to be the total taxable value of land and additions on the property. | Land | Improvement |
|---|---|---|---|---|
| 2025 | $6,168 | $681,500 | $475,600 | $205,900 |
| 2024 | $6,450 | $719,900 | $517,900 | $202,000 |
| 2023 | $5,693 | $569,300 | $401,600 | $167,700 |
| 2022 | $5,323 | $506,000 | $343,500 | $162,500 |
| 2021 | $4,872 | $467,600 | $306,500 | $161,100 |
| 2020 | $5,121 | $492,900 | $348,800 | $144,100 |
| 2019 | $4,726 | $440,000 | $295,900 | $144,100 |
| 2018 | $4,733 | $429,500 | $285,400 | $144,100 |
| 2017 | $4,495 | $408,300 | $264,200 | $144,100 |
| 2016 | $3,926 | $353,700 | $243,100 | $110,600 |
| 2015 | $3,802 | $343,100 | $232,500 | $110,600 |
| 2014 | $3,538 | $319,000 | $211,400 | $107,600 |
Seller's Agent in 2026
Kristen Gaughan
William Raveis R.E. & Home Services
(617) 852-3004
1 in this area
30 Total Sales
Buyer's Agent in 2026
Stephanie Curran
William Raveis R.E. & Home Services
(617) 510-3120
33 in this area
44 Total Sales
Source: MLS Property Information Network (MLS PIN)
MLS Number: 73448519
APN: MARB-000114-000063
Disclaimer: Certain information contained herein is derived from information provided by parties other than Homes.com. All information provided is deemed reliable, but is not guaranteed to be accurate and should be independently verified.
![]() The property listing data and information, or the Images, set forth herein were provided to MLS Property Information Network, Inc. from third party sources, including sellers, lessors and public records, and were compiled by MLS Property Information Network, Inc. The property listing data and information, and the Images, are for the personal, non-commercial use of consumers having a good faith interest in purchasing or leasing listed properties of the type displayed to them and may not be used for any purpose other than to identify prospective properties which such consumers may have a good faith interest in purchasing or leasing. MLS Property Information Network, Inc. and its subscribers disclaim any and all representations and warranties as to the accuracy of the property listing data and information, or as to the accuracy of any of the Images, set forth herein.
The property listing data and information, or the Images, set forth herein were provided to MLS Property Information Network, Inc. from third party sources, including sellers, lessors and public records, and were compiled by MLS Property Information Network, Inc. The property listing data and information, and the Images, are for the personal, non-commercial use of consumers having a good faith interest in purchasing or leasing listed properties of the type displayed to them and may not be used for any purpose other than to identify prospective properties which such consumers may have a good faith interest in purchasing or leasing. MLS Property Information Network, Inc. and its subscribers disclaim any and all representations and warranties as to the accuracy of the property listing data and information, or as to the accuracy of any of the Images, set forth herein.
Ask me questions while you tour the home.