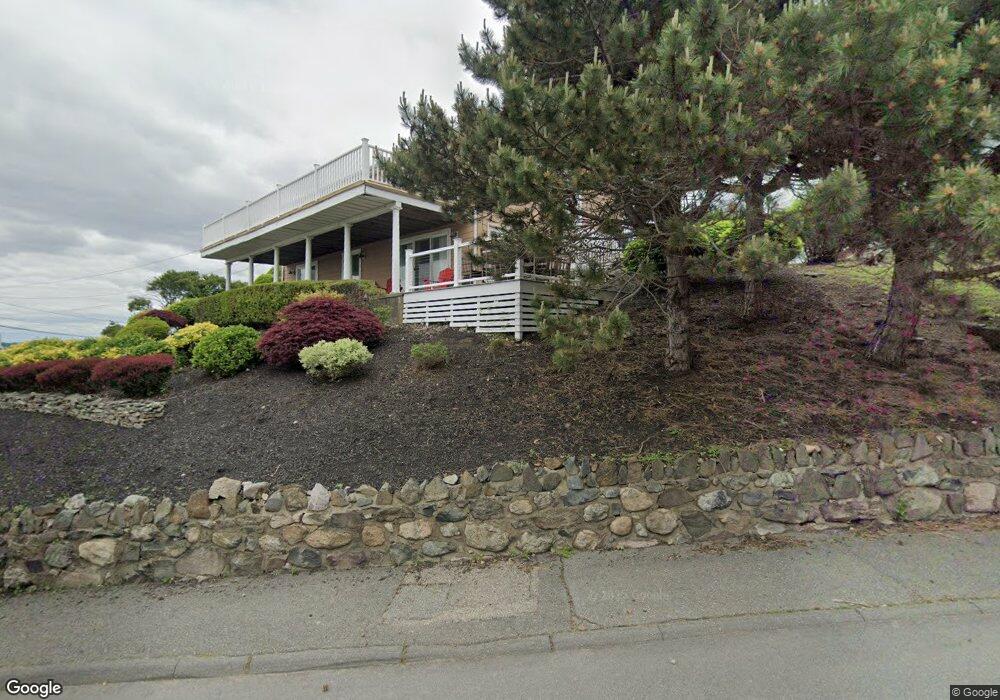
2 Little Nahant Rd Nahant, MA 01908
Estimated Value: $1,019,302 - $1,212,000
5
Beds
2
Baths
2,000
Sq Ft
$558/Sq Ft
Est. Value
About This Home
This home is located at 2 Little Nahant Rd, Nahant, MA 01908 and is currently estimated at $1,116,576, approximately $558 per square foot. 2 Little Nahant Rd is a home located in Essex County with nearby schools including Johnson Elementary School, Swampscott Middle School, and Swampscott High School.
Ownership History
Date
Name
Owned For
Owner Type
Purchase Details
Closed on
Oct 31, 2023
Sold by
Hanagan Gail M and Hanagan William H
Bought by
Breen Michael and Hanagan Nora
Current Estimated Value
Home Financials for this Owner
Home Financials are based on the most recent Mortgage that was taken out on this home.
Original Mortgage
$900,000
Outstanding Balance
$881,720
Interest Rate
7.19%
Mortgage Type
Purchase Money Mortgage
Estimated Equity
$234,856
Purchase Details
Closed on
Feb 16, 2018
Sold by
Hanagan Margaret M and Hanagan Hannaway E
Bought by
Hanagan Gail M and Hanagan William H
Purchase Details
Closed on
Nov 7, 2003
Sold by
Potter David J
Bought by
Hanagan Henry E and Hanagan Margaret M
Home Financials for this Owner
Home Financials are based on the most recent Mortgage that was taken out on this home.
Original Mortgage
$150,000
Interest Rate
6.01%
Mortgage Type
Purchase Money Mortgage
Purchase Details
Closed on
Aug 23, 1999
Sold by
Pica Stephen M and Pica Patrick P
Bought by
Potter David J
Create a Home Valuation Report for This Property
The Home Valuation Report is an in-depth analysis detailing your home's value as well as a comparison with similar homes in the area
Home Values in the Area
Average Home Value in this Area
Purchase History
| Date | Buyer | Sale Price | Title Company |
|---|---|---|---|
| Breen Michael | $950,000 | None Available | |
| Hanagan Gail M | $293,750 | -- | |
| Hanagan Gail M | $293,750 | -- | |
| Hanagan Gail M | $293,750 | -- | |
| Hanagan Henry E | $587,500 | -- | |
| Hanagan Henry E | $587,500 | -- | |
| Potter David J | $335,000 | -- | |
| Potter David J | $335,000 | -- |
Source: Public Records
Mortgage History
| Date | Status | Borrower | Loan Amount |
|---|---|---|---|
| Open | Breen Michael | $900,000 | |
| Previous Owner | Potter David J | $87,681 | |
| Previous Owner | Potter David J | $150,000 |
Source: Public Records
Tax History Compared to Growth
Tax History
| Year | Tax Paid | Tax Assessment Tax Assessment Total Assessment is a certain percentage of the fair market value that is determined by local assessors to be the total taxable value of land and additions on the property. | Land | Improvement |
|---|---|---|---|---|
| 2025 | $8,571 | $936,700 | $570,500 | $366,200 |
| 2024 | $8,614 | $949,700 | $570,500 | $379,200 |
| 2023 | $8,067 | $887,500 | $552,900 | $334,600 |
| 2022 | $7,996 | $816,800 | $500,300 | $316,500 |
| 2021 | $7,877 | $749,500 | $456,400 | $293,100 |
| 2020 | $7,794 | $710,500 | $456,400 | $254,100 |
| 2019 | $7,402 | $678,500 | $438,800 | $239,700 |
| 2018 | $6,413 | $625,700 | $395,000 | $230,700 |
| 2017 | $6,595 | $629,900 | $395,000 | $234,900 |
| 2016 | $6,335 | $602,200 | $377,400 | $224,800 |
| 2015 | $6,283 | $575,400 | $350,600 | $224,800 |
| 2014 | $6,050 | $548,500 | $318,600 | $229,900 |
Source: Public Records
Map
Nearby Homes
- 9 Little Nahant Rd
- 36 Lennox Rd
- 23 Phillips Rd
- 17 Pearl Rd
- 43 Maple Ave
- 2 Goddard Dr
- 66 Ocean St
- 183 Bass Point Rd
- 303 Nahant Rd
- 51 Cliff St
- 3 Cliff St
- 53 Lancaster Ave
- 98 Lynnway Unit 102
- 12 Chancery Ct Unit 205
- 12 Chancery Ct Unit 207
- 9 Beach Rd Unit 4
- 45 Tudor St Unit 3-8
- 41 Tudor St
- 154 Lynnway Unit 520
- 154 Lynnway Unit 205
- 42 Nahant Rd
- 4 Little Nahant Rd
- 1 Little Nahant Rd
- 4 Chamberlain Cir
- 5 Little Nahant Rd
- 8 Little Nahant Rd
- 38 Nahant Rd
- 38 Nahant Rd Unit 1
- 52 Nahant Rd
- 11 Linda Ln
- 2 Howe Rd
- 3 Howe Rd
- 10 Chamberlain Cir
- 36 Nahant Rd
- 10 Little Nahant Rd
- 9 Linda Ln
- 9 Linda Ln
- 9 Linda Ln Unit 1
- 11 Little Nahant Rd
- 4 Howe Rd