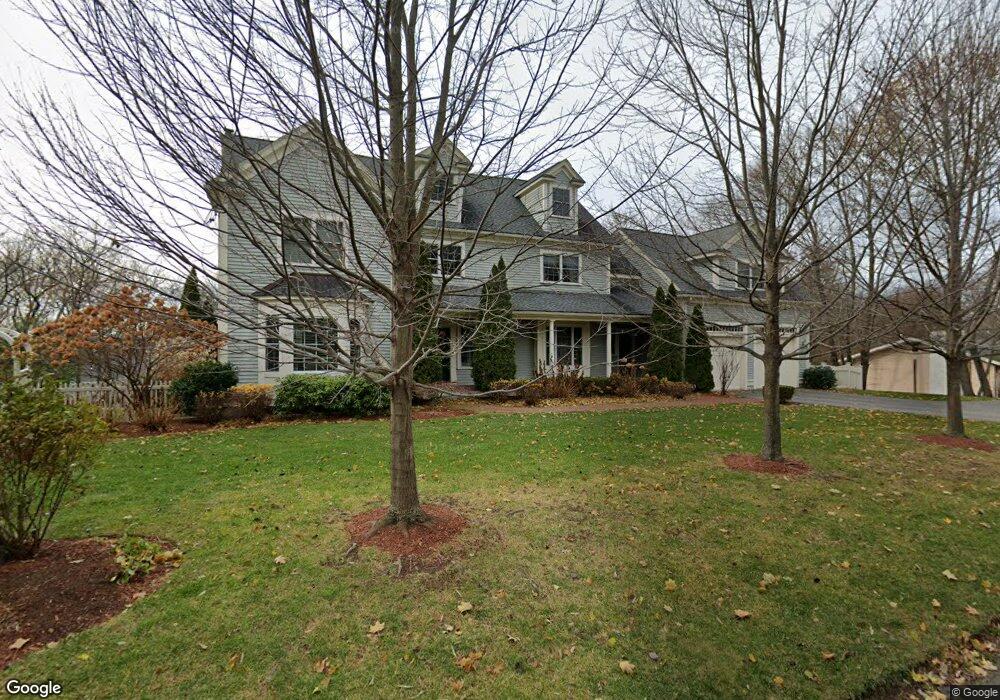
2 Locke Ln Lexington, MA 02420
Countryside NeighborhoodEstimated Value: $2,716,250 - $3,368,000
4
Beds
6
Baths
3,995
Sq Ft
$738/Sq Ft
Est. Value
About This Home
This home is located at 2 Locke Ln, Lexington, MA 02420 and is currently estimated at $2,949,813, approximately $738 per square foot. 2 Locke Ln is a home located in Middlesex County with nearby schools including Harrington Elementary School, Jonas Clarke Middle School, and Lexington High School.
Ownership History
Date
Name
Owned For
Owner Type
Purchase Details
Closed on
May 16, 2014
Sold by
Connor John and Connor Pamela A
Bought by
Pamela A Connor Ret
Current Estimated Value
Purchase Details
Closed on
Sep 24, 2010
Sold by
Locke Lane Llc
Bought by
Connor John and Connor Pamela A
Home Financials for this Owner
Home Financials are based on the most recent Mortgage that was taken out on this home.
Original Mortgage
$750,000
Interest Rate
4.48%
Mortgage Type
Purchase Money Mortgage
Purchase Details
Closed on
Aug 5, 2009
Sold by
Ogilvie Robert E
Bought by
Locke Lane Llc
Home Financials for this Owner
Home Financials are based on the most recent Mortgage that was taken out on this home.
Original Mortgage
$1,002,550
Interest Rate
5.47%
Mortgage Type
Purchase Money Mortgage
Create a Home Valuation Report for This Property
The Home Valuation Report is an in-depth analysis detailing your home's value as well as a comparison with similar homes in the area
Home Values in the Area
Average Home Value in this Area
Purchase History
| Date | Buyer | Sale Price | Title Company |
|---|---|---|---|
| Pamela A Connor Ret | -- | -- | |
| Connor John | $1,425,000 | -- | |
| Locke Lane Llc | $575,000 | -- |
Source: Public Records
Mortgage History
| Date | Status | Borrower | Loan Amount |
|---|---|---|---|
| Previous Owner | Connor John | $750,000 | |
| Previous Owner | Locke Lane Llc | $1,002,550 |
Source: Public Records
Tax History Compared to Growth
Tax History
| Year | Tax Paid | Tax Assessment Tax Assessment Total Assessment is a certain percentage of the fair market value that is determined by local assessors to be the total taxable value of land and additions on the property. | Land | Improvement |
|---|---|---|---|---|
| 2025 | $29,621 | $2,422,000 | $964,000 | $1,458,000 |
| 2024 | $28,494 | $2,326,000 | $918,000 | $1,408,000 |
| 2023 | $26,611 | $2,047,000 | $835,000 | $1,212,000 |
| 2022 | $25,889 | $1,876,000 | $760,000 | $1,116,000 |
| 2021 | $26,809 | $1,863,000 | $754,000 | $1,109,000 |
| 2020 | $24,840 | $1,768,000 | $754,000 | $1,014,000 |
| 2019 | $24,244 | $1,717,000 | $718,000 | $999,000 |
| 2018 | $8,044 | $1,639,000 | $684,000 | $955,000 |
| 2017 | $22,996 | $1,587,000 | $652,000 | $935,000 |
| 2016 | $22,966 | $1,573,000 | $620,000 | $953,000 |
| 2015 | $22,008 | $1,481,000 | $564,000 | $917,000 |
| 2014 | $21,481 | $1,385,000 | $513,000 | $872,000 |
Source: Public Records
Map
Nearby Homes