Estimated Value: $164,000 - $224,000
--
Bed
--
Bath
1,587
Sq Ft
$124/Sq Ft
Est. Value
About This Home
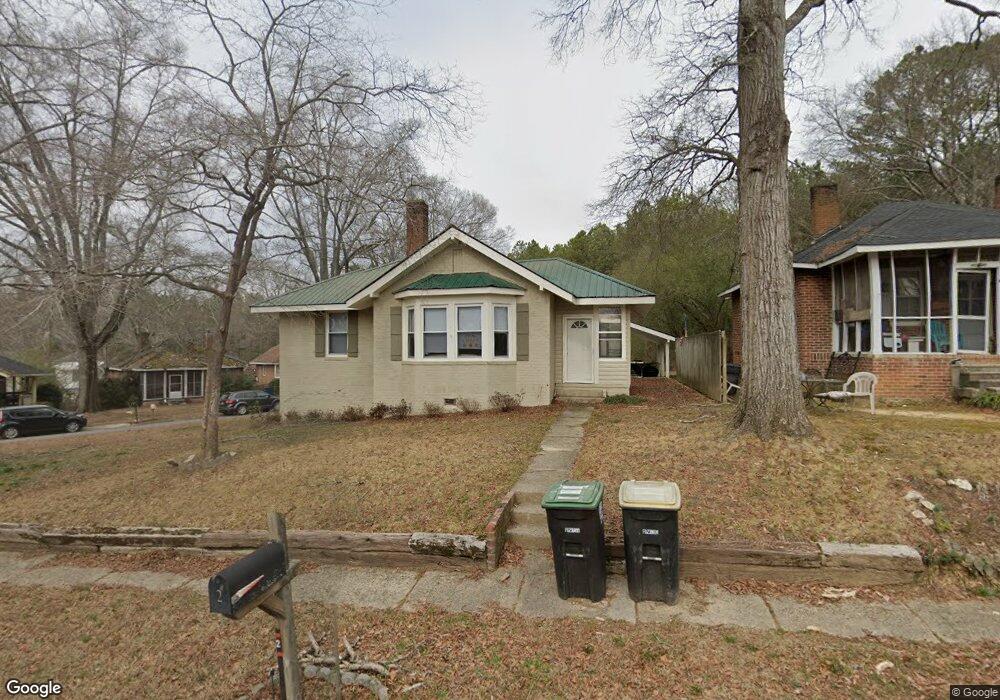
This home is located at 2 Locust St NE, Rome, GA 30161 and is currently estimated at $196,431, approximately $123 per square foot. 2 Locust St NE is a home located in Floyd County with nearby schools including Rome High School, Unity Christian School, and St. Mary School.
Ownership History
Date
Name
Owned For
Owner Type
Purchase Details
Closed on
Oct 13, 2022
Sold by
Peek April L
Bought by
Dlg Re Investments Llc
Current Estimated Value
Home Financials for this Owner
Home Financials are based on the most recent Mortgage that was taken out on this home.
Original Mortgage
$76,000
Outstanding Balance
$69,739
Interest Rate
6.02%
Mortgage Type
Mortgage Modification
Estimated Equity
$126,692
Purchase Details
Closed on
Dec 28, 2006
Sold by
Not Provided
Bought by
Peek April L
Purchase Details
Closed on
Oct 9, 1995
Sold by
Wood Dorothy
Bought by
Peek April L
Purchase Details
Closed on
Jul 8, 1991
Sold by
Gore Leonard G and Gore Linda H
Bought by
Wood Dorothy
Purchase Details
Closed on
May 4, 1984
Bought by
P and R
Purchase Details
Closed on
Oct 20, 1980
Sold by
Edwards Robert L and Patsy Jo
Bought by
Gore Leonard G and Gore Linda H
Purchase Details
Closed on
Apr 8, 1975
Sold by
Greenway Sidney L and Greenway Julia E
Bought by
Edwards Robert L and Patsy Jo
Purchase Details
Closed on
Feb 25, 1975
Sold by
Goddard James I and Goddard Eva H
Bought by
Greenway Sidney L and Greenway Julia E
Purchase Details
Closed on
Jan 1, 1901
Bought by
Goddard James I and Goddard Eva H
Create a Home Valuation Report for This Property
The Home Valuation Report is an in-depth analysis detailing your home's value as well as a comparison with similar homes in the area
Home Values in the Area
Average Home Value in this Area
Purchase History
| Date | Buyer | Sale Price | Title Company |
|---|---|---|---|
| Dlg Re Investments Llc | $95,000 | -- | |
| Peek April L | -- | -- | |
| Peek April L | $52,500 | -- | |
| Wood Dorothy | $25,500 | -- | |
| P | -- | -- | |
| Gore Leonard G | $21,500 | -- | |
| Edwards Robert L | $15,000 | -- | |
| Greenway Sidney L | $16,800 | -- | |
| Goddard James I | -- | -- |
Source: Public Records
Mortgage History
| Date | Status | Borrower | Loan Amount |
|---|---|---|---|
| Open | Dlg Re Investments Llc | $76,000 |
Source: Public Records
Tax History Compared to Growth
Tax History
| Year | Tax Paid | Tax Assessment Tax Assessment Total Assessment is a certain percentage of the fair market value that is determined by local assessors to be the total taxable value of land and additions on the property. | Land | Improvement |
|---|---|---|---|---|
| 2024 | $2,963 | $76,102 | $17,638 | $58,464 |
| 2023 | $1,334 | $68,382 | $15,942 | $52,440 |
| 2022 | $1,365 | $51,947 | $13,229 | $38,718 |
| 2021 | $1,293 | $46,690 | $12,211 | $34,479 |
| 2020 | $1,214 | $41,701 | $9,328 | $32,373 |
| 2019 | $1,148 | $38,448 | $9,328 | $29,120 |
| 2018 | $1,112 | $36,394 | $9,328 | $27,066 |
| 2017 | $1,091 | $35,172 | $9,328 | $25,844 |
| 2016 | $1,076 | $34,160 | $8,800 | $25,360 |
| 2015 | $995 | $33,240 | $4,400 | $28,840 |
| 2014 | $995 | $32,425 | $4,400 | $28,025 |
Source: Public Records
Map
Nearby Homes
- 27 Oak St NE
- 23 Oak St NE
- 42 Dogwood St NE
- 40 Dogwood St NE
- 1 Fir St NE
- 7 Ash St NE
- 0 Cypress St NE Unit 7494593
- 0 Cypress St NE Unit 10422946
- 0 Euclid Ave Unit 10617853
- 4 N Haven Dr
- 311 Reynolds St NE
- 411 Woodward St NE
- 205 Couper St NE
- 17 Joplin St NE
- 0 Veterans Memorial Hwy NE Unit 10565194
- 0 Veterans Memorial Hwy NE Unit 10503178
- 219 North Ave NE
- 302 Tolbert St
- 541 Reece St NE
- 2 Lindberg Dr NE
- 4 Locust St NE
- 6 Locust St NE
- 20 Norwood St NE
- 18 Norwood St NE
- 22 Norwood St NE
- 3 Locust St NE
- 1 Locust St NE
- 8 Locust St NE
- 16 Norwood St NE
- 5 Locust St NE Unit 92
- 5 Locust St NE
- 7 Locust St NE
- 14 Norwood St NE
- 9 Norwood St NE Unit LT95
- 9 Norwood St NE
- 9 Locust St NE
- 15 Mahogany St NE
- 17 Mahogany St NE
- 13 Mahogany St NE
- 0 Norwood St NE Unit 8647198