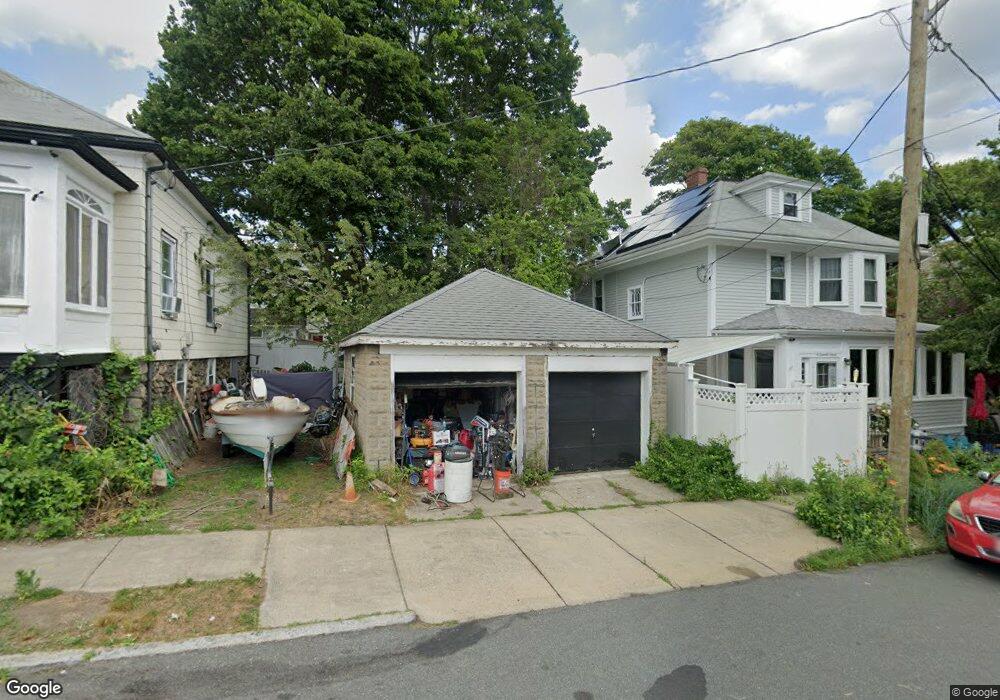
2 Lowell St Salem, MA 01970
Salem Willows NeighborhoodEstimated Value: $664,197 - $688,000
4
Beds
1
Bath
1,409
Sq Ft
$479/Sq Ft
Est. Value
About This Home
This home is located at 2 Lowell St, Salem, MA 01970 and is currently estimated at $674,299, approximately $478 per square foot. 2 Lowell St is a home located in Essex County with nearby schools including Carlton Elementary School, Saltonstall School, and Bates Elementary School.
Ownership History
Date
Name
Owned For
Owner Type
Purchase Details
Closed on
May 28, 2025
Sold by
Centorino Matthew M
Bought by
Centorino Dawn M and Centorino Matthew M
Current Estimated Value
Purchase Details
Closed on
Oct 1, 2002
Sold by
Doucette Debra A and Centorino Matthew M
Bought by
Centorino Matthew M
Purchase Details
Closed on
May 15, 1998
Sold by
Jeffrey William D and Chse Mary Ann
Bought by
Doucette Debra A
Create a Home Valuation Report for This Property
The Home Valuation Report is an in-depth analysis detailing your home's value as well as a comparison with similar homes in the area
Home Values in the Area
Average Home Value in this Area
Purchase History
| Date | Buyer | Sale Price | Title Company |
|---|---|---|---|
| Centorino Dawn M | -- | None Available | |
| Centorino Dawn M | -- | None Available | |
| Centorino Dawn M | -- | None Available | |
| Centorino Matthew M | $40,000 | -- | |
| Centorino Matthew M | $40,000 | -- | |
| Doucette Debra A | $150,500 | -- | |
| Doucette Debra A | $150,500 | -- |
Source: Public Records
Mortgage History
| Date | Status | Borrower | Loan Amount |
|---|---|---|---|
| Previous Owner | Doucette Debra A | $219,730 | |
| Previous Owner | Doucette Debra A | $220,000 |
Source: Public Records
Tax History
| Year | Tax Paid | Tax Assessment Tax Assessment Total Assessment is a certain percentage of the fair market value that is determined by local assessors to be the total taxable value of land and additions on the property. | Land | Improvement |
|---|---|---|---|---|
| 2025 | $6,279 | $553,700 | $276,700 | $277,000 |
| 2024 | $6,114 | $526,200 | $263,800 | $262,400 |
| 2023 | $5,902 | $471,800 | $244,500 | $227,300 |
| 2022 | $5,748 | $433,800 | $231,700 | $202,100 |
| 2021 | $5,640 | $408,700 | $225,200 | $183,500 |
| 2020 | $5,676 | $392,800 | $225,200 | $167,600 |
| 2019 | $5,744 | $380,400 | $225,200 | $155,200 |
| 2018 | $5,706 | $371,000 | $215,600 | $155,400 |
| 2017 | $5,527 | $348,500 | $193,100 | $155,400 |
| 2016 | $5,209 | $332,400 | $177,000 | $155,400 |
| 2015 | $5,135 | $312,900 | $160,900 | $152,000 |
Source: Public Records
Map
Nearby Homes
- 5 Winter Island Rd
- 7 Lothrop St
- 23 1/2 Lovett St
- 8 Webb St
- 17 Webb St Unit 1
- 24 Franklin Place
- 21 Emerton St Unit 2
- 13 Fayette St Unit 3
- 12 Summit Ave Unit 4
- 16 School St Unit 3
- 50 Rantoul St Unit 509S
- 40 Essex St Unit 2
- 60 Rantoul St Unit 604N
- 60 Rantoul St Unit 114N
- 40 Railroad Ave Unit B2
- 7 Forrester St
- 131 Derby St Unit 3F
- 69 Essex St Unit 2
- 31 N Washington Square Unit 3
- 7 Curtis St Unit 1
Your Personal Tour Guide
Ask me questions while you tour the home.