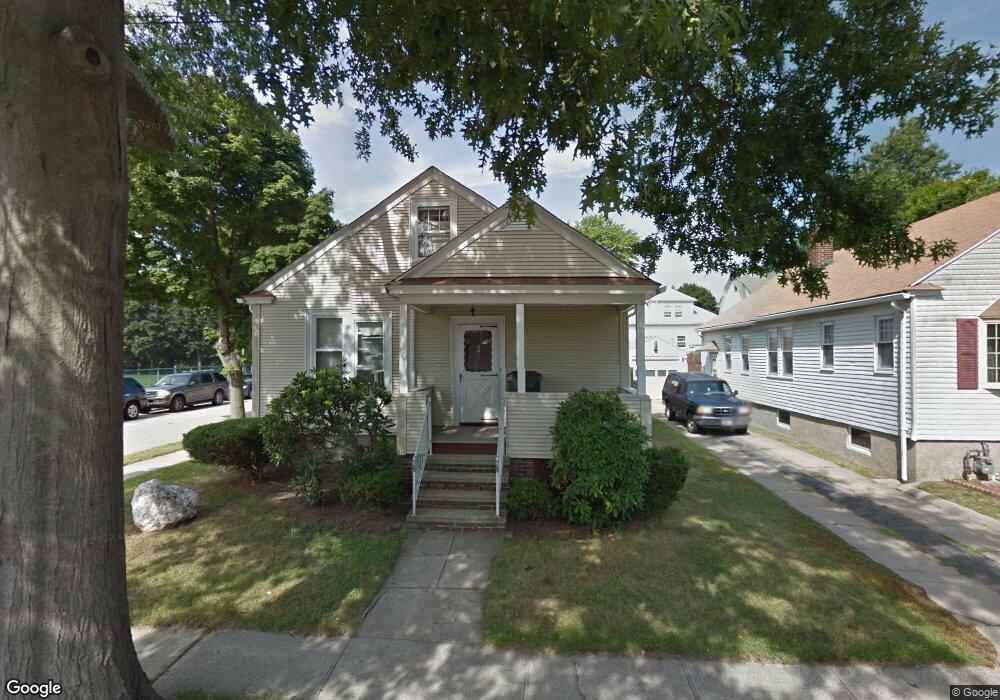
2 Lucille St Providence, RI 02908
Elmhurst NeighborhoodEstimated Value: $354,130
2
Beds
1
Bath
1,038
Sq Ft
$341/Sq Ft
Est. Value
About This Home
This home is located at 2 Lucille St, Providence, RI 02908 and is currently estimated at $354,130, approximately $341 per square foot. 2 Lucille St is a home located in Providence County with nearby schools including Asa Messer Elementary School, Charles N. Fortes Elementary School, and Veazie Street Elementary School.
Ownership History
Date
Name
Owned For
Owner Type
Purchase Details
Closed on
Dec 30, 2013
Sold by
Dunham Deborah A
Bought by
Providence College
Current Estimated Value
Purchase Details
Closed on
Jun 1, 1989
Sold by
Curran Robert F
Bought by
Dunham David J
Create a Home Valuation Report for This Property
The Home Valuation Report is an in-depth analysis detailing your home's value as well as a comparison with similar homes in the area
Home Values in the Area
Average Home Value in this Area
Purchase History
| Date | Buyer | Sale Price | Title Company |
|---|---|---|---|
| Providence College | $140,000 | -- | |
| Dunham David J | $90,000 | -- |
Source: Public Records
Mortgage History
| Date | Status | Borrower | Loan Amount |
|---|---|---|---|
| Previous Owner | Dunham David J | $60,000 | |
| Previous Owner | Dunham David J | $10,000 | |
| Previous Owner | Dunham David J | $80,000 | |
| Previous Owner | Dunham David J | $80,000 |
Source: Public Records
Tax History Compared to Growth
Tax History
| Year | Tax Paid | Tax Assessment Tax Assessment Total Assessment is a certain percentage of the fair market value that is determined by local assessors to be the total taxable value of land and additions on the property. | Land | Improvement |
|---|---|---|---|---|
| 2025 | $4,774 | $344,700 | $159,600 | $185,100 |
| 2024 | $4,774 | $268,200 | $103,800 | $164,400 |
| 2023 | $4,774 | $268,200 | $103,800 | $164,400 |
| 2022 | $0 | $268,200 | $103,800 | $164,400 |
| 2021 | $0 | $193,000 | $79,100 | $113,900 |
| 2020 | $0 | $193,000 | $79,100 | $113,900 |
| 2019 | $0 | $193,000 | $79,100 | $113,900 |
| 2018 | $0 | $145,700 | $63,600 | $82,100 |
| 2017 | $4,657 | $145,700 | $63,600 | $82,100 |
| 2016 | $3,677 | $145,700 | $63,600 | $82,100 |
| 2015 | $3,677 | $111,100 | $63,600 | $47,500 |
| 2014 | $3,750 | $111,100 | $63,600 | $47,500 |
| 2013 | $3,750 | $111,100 | $63,600 | $47,500 |
Source: Public Records
Map
Nearby Homes