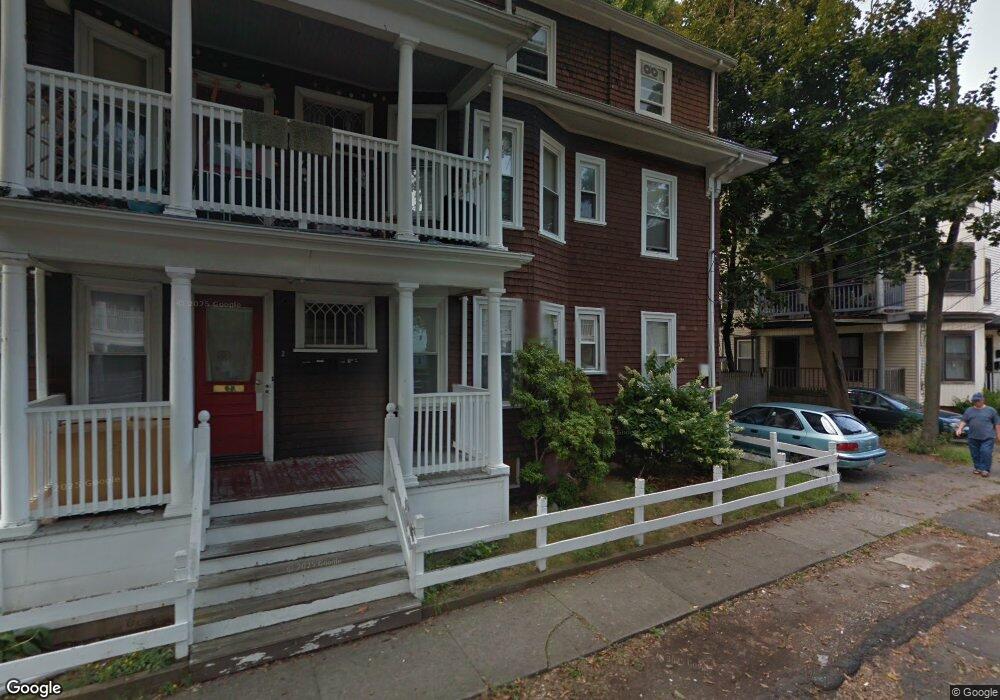
2 Mace Place Unit 2 Lynn, MA 01902
Diamond District NeighborhoodEstimated Value: $1,070,000 - $1,134,000
3
Beds
1
Bath
1,300
Sq Ft
$852/Sq Ft
Est. Value
About This Home
This home is located at 2 Mace Place Unit 2, Lynn, MA 01902 and is currently estimated at $1,107,000, approximately $851 per square foot. 2 Mace Place Unit 2 is a home located in Essex County with nearby schools including Brickett Elementary School, William R. Fallon School, and Marshall Middle School.
Ownership History
Date
Name
Owned For
Owner Type
Purchase Details
Closed on
Nov 19, 2009
Sold by
Win Win Prop Llc
Bought by
Robten Realty Llc
Current Estimated Value
Purchase Details
Closed on
Oct 16, 2006
Sold by
Belmonte Peter J
Bought by
Dorval Michael
Purchase Details
Closed on
Aug 6, 1996
Sold by
Morningstar Rt and Tzortizis John K
Bought by
Sousa Joseph M and Belmonte Peter
Purchase Details
Closed on
Dec 8, 1993
Sold by
Shore Bk & Trust
Bought by
Tzortzis John K
Purchase Details
Closed on
Nov 12, 1992
Sold by
Mace Place Rt
Bought by
Fdic
Create a Home Valuation Report for This Property
The Home Valuation Report is an in-depth analysis detailing your home's value as well as a comparison with similar homes in the area
Home Values in the Area
Average Home Value in this Area
Purchase History
| Date | Buyer | Sale Price | Title Company |
|---|---|---|---|
| Robten Realty Llc | $260,000 | -- | |
| Win Win Prop Llc | $210,000 | -- | |
| Robten Realty Llc | $260,000 | -- | |
| Dorval Michael | $490,000 | -- | |
| Dorval Michael | $490,000 | -- | |
| Sousa Joseph M | $87,000 | -- | |
| Sousa Joseph M | $87,000 | -- | |
| Tzortzis John K | $42,500 | -- | |
| Tzortzis John K | $42,500 | -- | |
| Fdic | $125,800 | -- | |
| Fdic | $125,800 | -- |
Source: Public Records
Mortgage History
| Date | Status | Borrower | Loan Amount |
|---|---|---|---|
| Open | Fdic | $625,000 |
Source: Public Records
Tax History Compared to Growth
Tax History
| Year | Tax Paid | Tax Assessment Tax Assessment Total Assessment is a certain percentage of the fair market value that is determined by local assessors to be the total taxable value of land and additions on the property. | Land | Improvement |
|---|---|---|---|---|
| 2025 | $10,388 | $1,002,700 | $207,100 | $795,600 |
| 2024 | $10,596 | $1,006,300 | $219,500 | $786,800 |
| 2023 | $10,087 | $904,700 | $203,400 | $701,300 |
| 2022 | $9,795 | $788,000 | $161,900 | $626,100 |
| 2021 | $9,488 | $728,200 | $159,000 | $569,200 |
| 2020 | $8,910 | $664,900 | $142,400 | $522,500 |
| 2019 | $8,727 | $610,300 | $138,200 | $472,100 |
| 2018 | $8,002 | $528,200 | $129,100 | $399,100 |
| 2017 | $7,866 | $504,200 | $122,900 | $381,300 |
| 2016 | $7,441 | $459,900 | $120,400 | $339,500 |
| 2015 | $6,921 | $413,200 | $124,500 | $288,700 |
Source: Public Records
Map
Nearby Homes
- 7 Cherry St
- 38 Cherry St Unit 1
- 229 Lewis St
- 13 Portland St Unit 4
- 62 Estes St Unit 2
- 23 Atlantic Terrace Unit 2
- 21 Atlantic Terrace Unit 1
- 38 Chestnut St
- 24 Stephen St Unit 2
- 96 Lewis St
- 285 Lynn Shore Dr Unit 203
- 285 Lynn Shore Dr Unit 304
- 285 Lynn Shore Dr Unit 205
- 285 Lynn Shore Dr Unit 508
- 285 Lynn Shore Dr Unit 207
- 285 Lynn Shore Dr Unit 208
- 295 Lynn Shore Dr Unit 401
- 300 Lynn Shore Dr Unit 408
- 300 Lynn Shore Dr Unit 807
- 300 Lynn Shore Dr Unit 612
- 2 Mace Place
- 30 Breed St
- 8 Mace Place Unit 10
- 1200 Breed Unit 1a
- 38 Breed St Unit 3
- 38 Breed St Unit 2
- 38 Breed St
- 26 Breed St
- 33 Mace Place Unit 1
- 3 Mace Place
- 3 Mace Place Unit 1
- 3 Mace Place Unit 2
- 14 Mace Place
- 9 Mace Place Unit 3
- 9 Mace Place
- 7 Mace Place Unit 1
- 7 Mace Place Unit 7
- 7 Mace Place Unit 2
- 7 Mace Place
- 9 Mace Place Unit 2