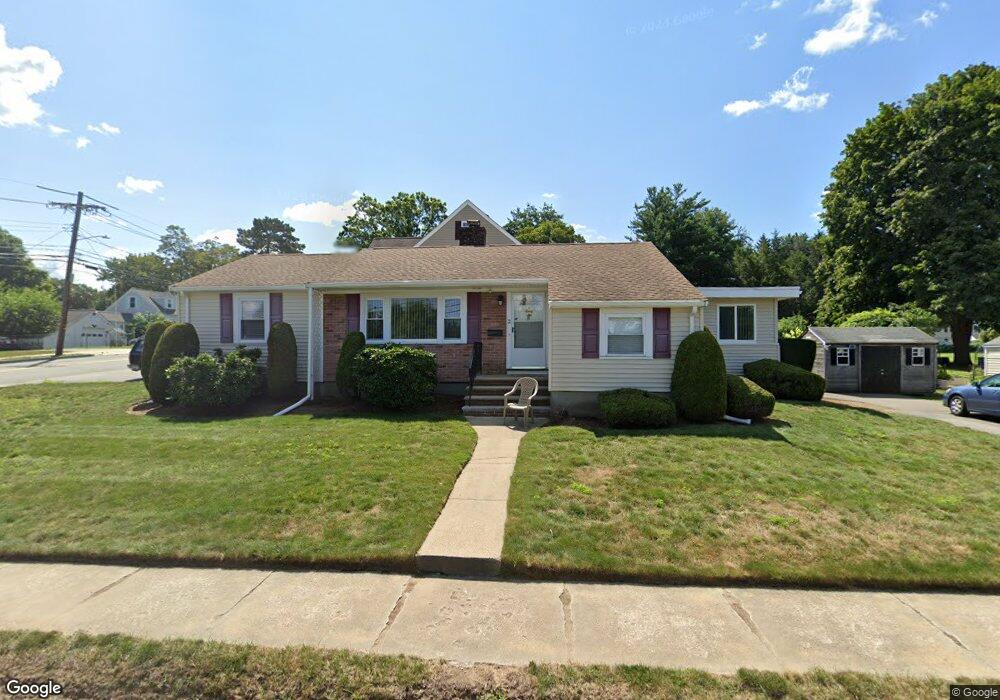
2 Magnolia Terrace Stoneham, MA 02180
Lindenwood NeighborhoodEstimated Value: $721,000 - $788,000
3
Beds
2
Baths
1,857
Sq Ft
$406/Sq Ft
Est. Value
About This Home
This home is located at 2 Magnolia Terrace, Stoneham, MA 02180 and is currently estimated at $753,932, approximately $405 per square foot. 2 Magnolia Terrace is a home located in Middlesex County with nearby schools including Stoneham High School, St. Patrick Elementary School, and St Joseph School.
Ownership History
Date
Name
Owned For
Owner Type
Purchase Details
Closed on
Dec 28, 2007
Sold by
Pappalardo Anthony W and Lynch Carmella
Bought by
Lynch Carmella and Cali Scott A
Current Estimated Value
Home Financials for this Owner
Home Financials are based on the most recent Mortgage that was taken out on this home.
Original Mortgage
$326,250
Outstanding Balance
$207,113
Interest Rate
6.27%
Mortgage Type
Purchase Money Mortgage
Estimated Equity
$546,819
Purchase Details
Closed on
May 26, 1995
Sold by
Raftell Anna
Bought by
Pappalardo Anthony W and Pappalardo Mary F
Home Financials for this Owner
Home Financials are based on the most recent Mortgage that was taken out on this home.
Original Mortgage
$80,000
Interest Rate
8.33%
Mortgage Type
Purchase Money Mortgage
Create a Home Valuation Report for This Property
The Home Valuation Report is an in-depth analysis detailing your home's value as well as a comparison with similar homes in the area
Home Values in the Area
Average Home Value in this Area
Purchase History
| Date | Buyer | Sale Price | Title Company |
|---|---|---|---|
| Lynch Carmella | $362,500 | -- | |
| Pappalardo Anthony W | $165,000 | -- |
Source: Public Records
Mortgage History
| Date | Status | Borrower | Loan Amount |
|---|---|---|---|
| Open | Lynch Carmella | $326,250 | |
| Previous Owner | Pappalardo Anthony W | $100,000 | |
| Previous Owner | Pappalardo Anthony W | $15,000 | |
| Previous Owner | Pappalardo Anthony W | $80,000 |
Source: Public Records
Tax History Compared to Growth
Tax History
| Year | Tax Paid | Tax Assessment Tax Assessment Total Assessment is a certain percentage of the fair market value that is determined by local assessors to be the total taxable value of land and additions on the property. | Land | Improvement |
|---|---|---|---|---|
| 2025 | $6,914 | $675,900 | $377,100 | $298,800 |
| 2024 | $6,672 | $630,000 | $348,900 | $281,100 |
| 2023 | $6,552 | $590,300 | $320,600 | $269,700 |
| 2022 | $5,804 | $557,500 | $301,700 | $255,800 |
| 2021 | $5,702 | $527,000 | $282,900 | $244,100 |
| 2020 | $5,683 | $526,700 | $279,400 | $247,300 |
| 2019 | $5,564 | $495,900 | $257,700 | $238,200 |
| 2018 | $5,329 | $455,100 | $232,900 | $222,200 |
| 2017 | $5,115 | $412,800 | $218,100 | $194,700 |
| 2016 | $4,897 | $385,600 | $209,000 | $176,600 |
| 2015 | $4,793 | $369,800 | $209,000 | $160,800 |
| 2014 | $4,530 | $335,800 | $190,800 | $145,000 |
Source: Public Records
Map
Nearby Homes
- 97 Oak St
- 159 Main St Unit 41C
- 159 Main St Unit 12B
- 20 Oak St
- 68 Main St Unit 36C
- 8 Steele St
- 64 Main St Unit 41B
- 40 Main St Unit 505
- 13 Elaine Rd
- 62 High St Unit 4
- 62 High St Unit 3
- 62 High St Unit Lot 12
- 62 High St Unit Lot 2
- 62 High St Unit Lot 9
- 1 Tremont St
- 12 Cottage St
- 21 Tremont St Unit A
- 62 Abigail Way Unit 3004
- 200 Ledgewood Dr Unit 505
- 100 Ledgewood Dr Unit 618